
Sweetwater 1
Project of IREN
Where it stands
IREN energized the Sweetwater 1 high-voltage substation on schedule in calendar Q2 2026 (around April). Construction is underway on an initial 300MW gross (about 200MW IT load) phase of liquid-cooled data centers, targeted for delivery in Q4 2027, and continued construction was reported as of October 2026. No data center capacity is in service yet. A TradingKey article's claim that the 1.4GW facility 'became operational in April 2026' conflates substation energization with data center operation and is contradicted by company filings. The 1,100MW remainder is derived from 1,400MW minus 300MW; the cited P48 figure of 1,700MW covers both Sweetwater sites.
300 MW under construction · 1,400 MW planned
| Phase | MW | Status | Date | Source |
|---|---|---|---|---|
| High-voltage substation / ERCOT grid connection | operational | We energized the Sweetwater 1 substation on schedule, advanced the Horizon 1-4 liquid-cooled data centers at Childress 2026-05-07 View cached copy (2026-09-08)Live source ↗ | ||
| Initial phase (liquid-cooled data centers, ~200MW IT / 300MW gross) | 300 | under construction | Construction is currently underway for 300MW (gross) of data center capacity at this site. The company targets delivery of this initial phase in Q4 2027. 2026-09-14 View cached copy (2026-09-20)Live source ↗ | |
| Remaining Sweetwater 1 build-out | 1100 | planned | only 300MW of gross capacity currently under construction with a Q4 2027 delivery target, indicating that the remaining 1,700MW is still in pre-construction or planning phases 2026-09-14 View cached copy (2026-09-20)Live source ↗ |
Assessed October 18, 2026 from the newest filings, releases and reporting that name this project (newest relied on: October 12, 2026).
Capacity
What has actually been delivered, against what has been promised. Each figure links to the statement it came from.
| Stage | Capacity | As of | Source |
|---|---|---|---|
| Energized power flowing today | 1,400 MW | 2026-08-22 | Sweetwater 1 facility operational |
| Contracted a customer is on the hook | -- | ||
| Under construction | 1,400 MW | 2025-07-06 | Sweetwater 1 energization April 2026 |
| Permitted | -- | ||
| Interconnect approved utility has agreed to deliver | 1,400 MW | 2025-03-19 | Sweetwater 1,400MW load capacity secured |
| Interconnect requested in a queue, nothing approved | -- | ||
| Announced a press-release figure | 2,000 MW | 2026-08-13 | Sweetwater data center planned capacity |
Claims about this project
Site intelligence
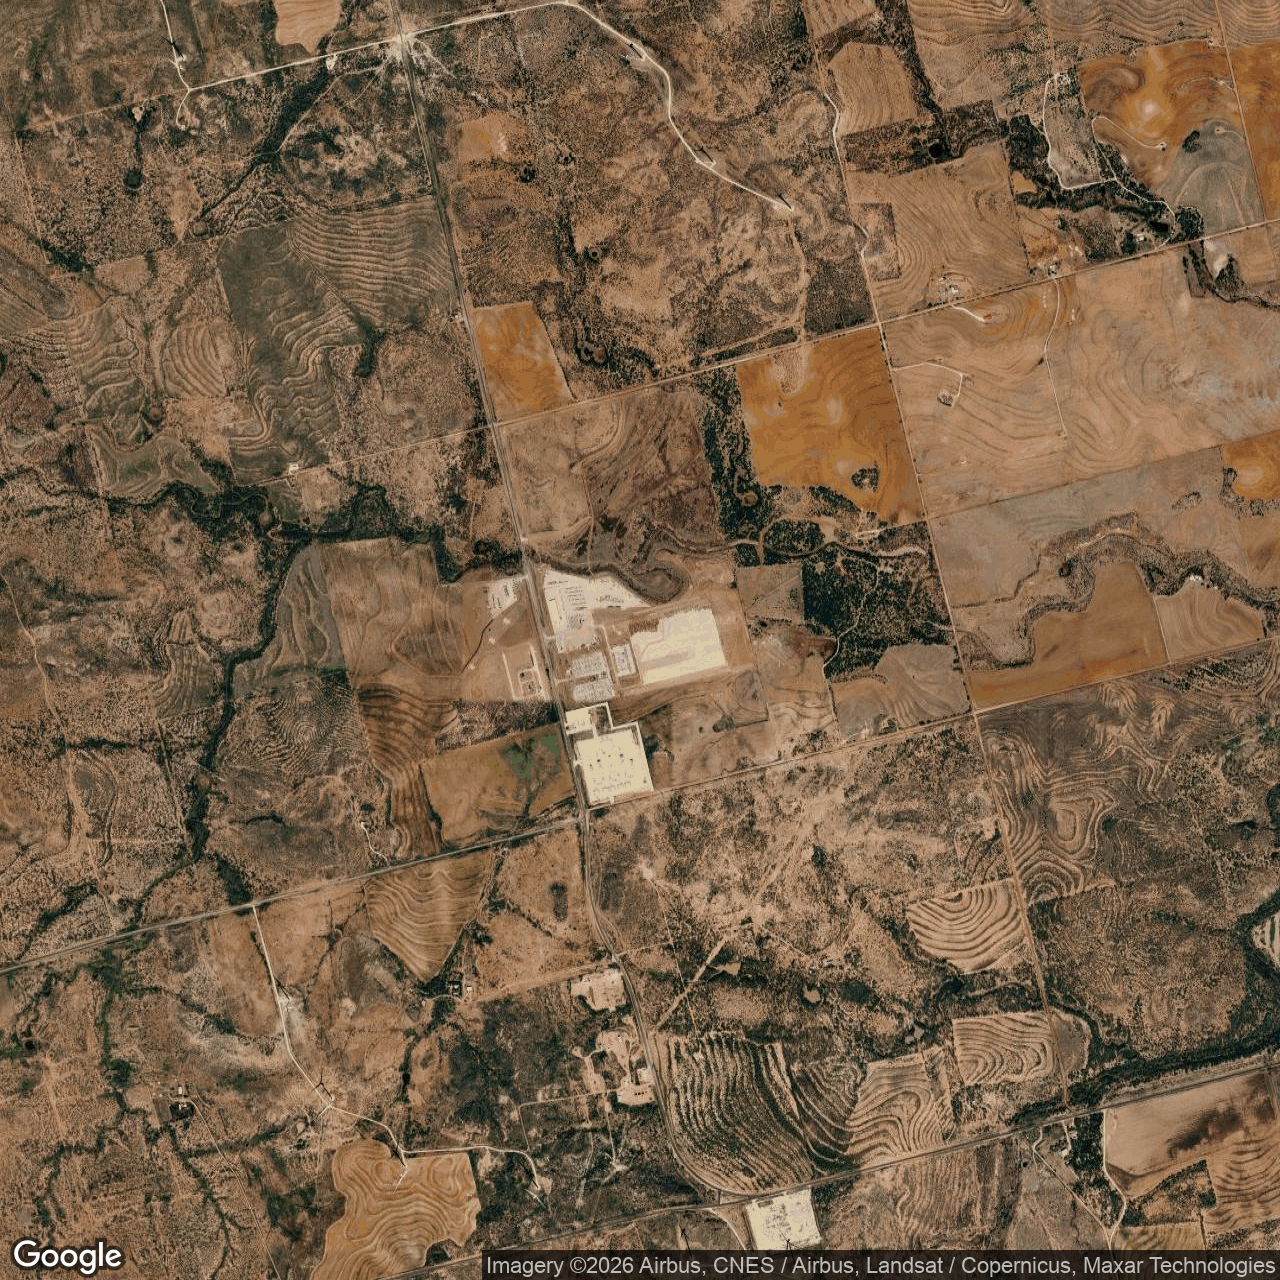
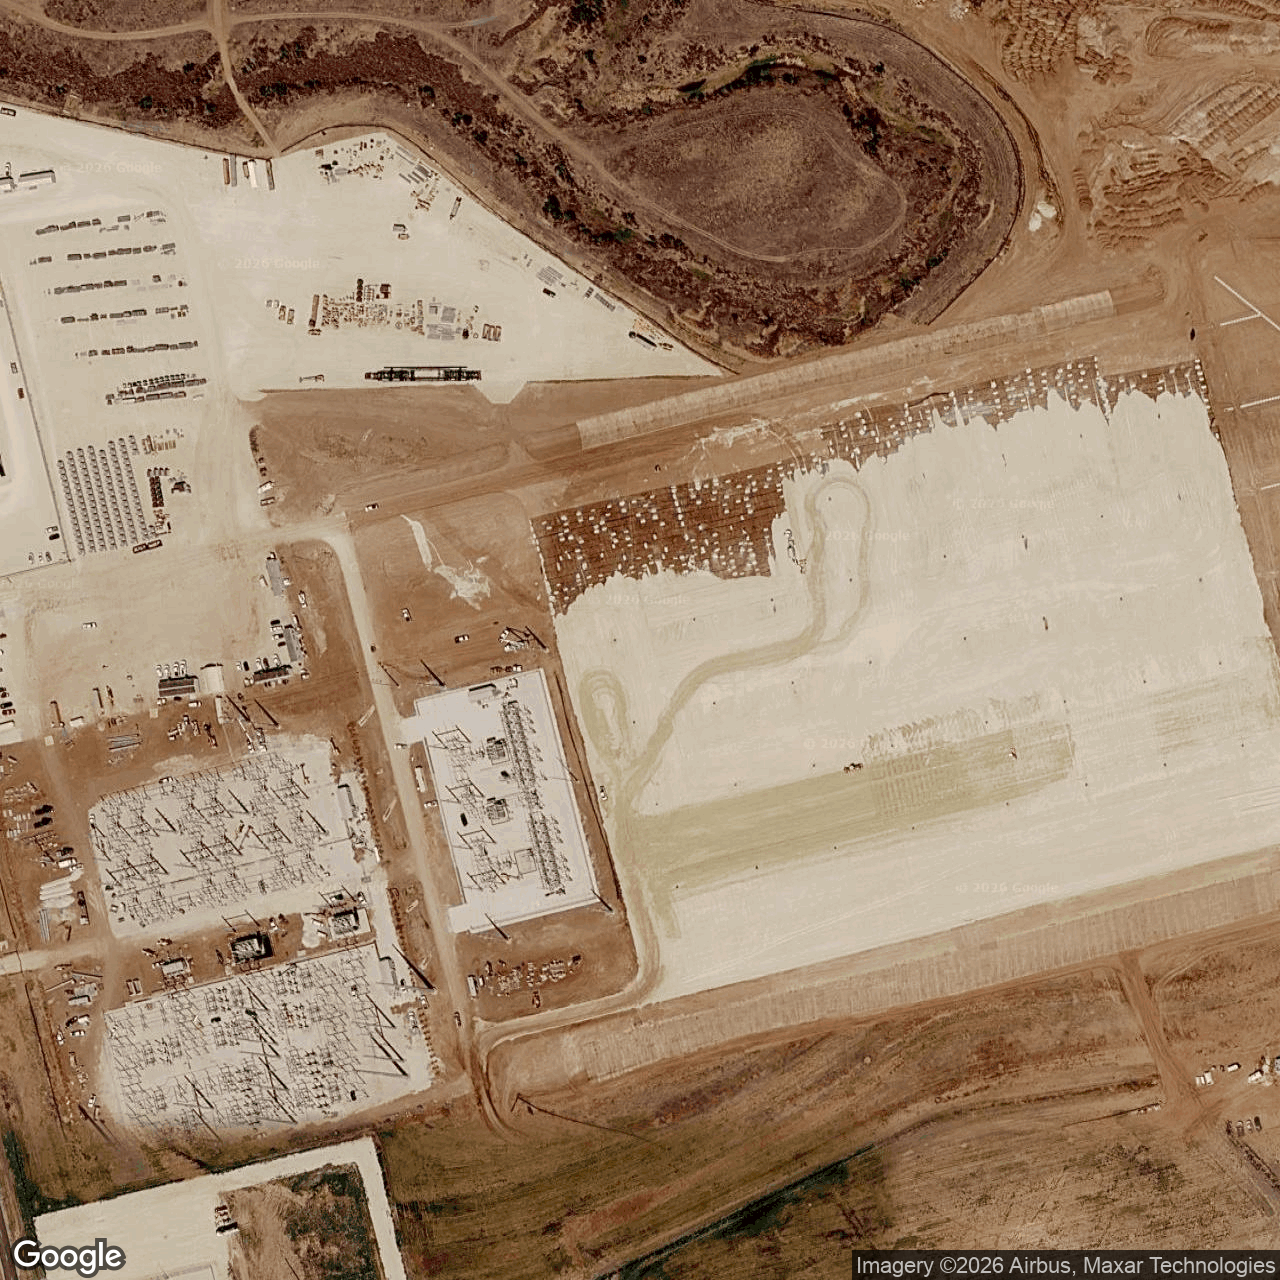


How we located this site
- Starting point (the project's stated locality) 2026-10-19
883 FM 611, Sweetwater, TX 79556 → 32.62798, -100.54724 (street) - Located from a published address 2026-10-19
883 FM 611, Sweetwater, TX 79556 → 32.62798, -100.54724 (street) - OpenStreetMap features nearby 2026-10-19
0 named match(es)
- 2026-07-06 vs 2026-06-17: structural change (radar signal shift)
- 2024-08-14 vs 2024-07-21: structural change (radar signal shift)
- 2024-12-12 vs 2024-11-18: structural change (radar signal shift)
- 2024-11-18 vs 2024-10-13: structural change (radar signal shift)
- 2025-06-10 vs 2025-05-17: structural change (radar signal shift)
Satellite imagery on this page is drawn from the Google Earth satellite basemap, USDA NAIP aerial photography (~1 m/pixel), ESA Sentinel-2 multispectral (10 m, with per-date cloud masks), NASA / USGS Landsat 8/9 (30 m, plus surface temperature), ESA Sentinel-1 radar (all-weather, night), NASA ECOSTRESS thermal (~70 m), and NASA Black Marble night lights (500 m, daily). Each image is dated, labelled by source and pixel resolution, and downloadable at its native size; cloudy dates are kept and marked rather than hidden. New scenes are pulled daily as each provider publishes them.