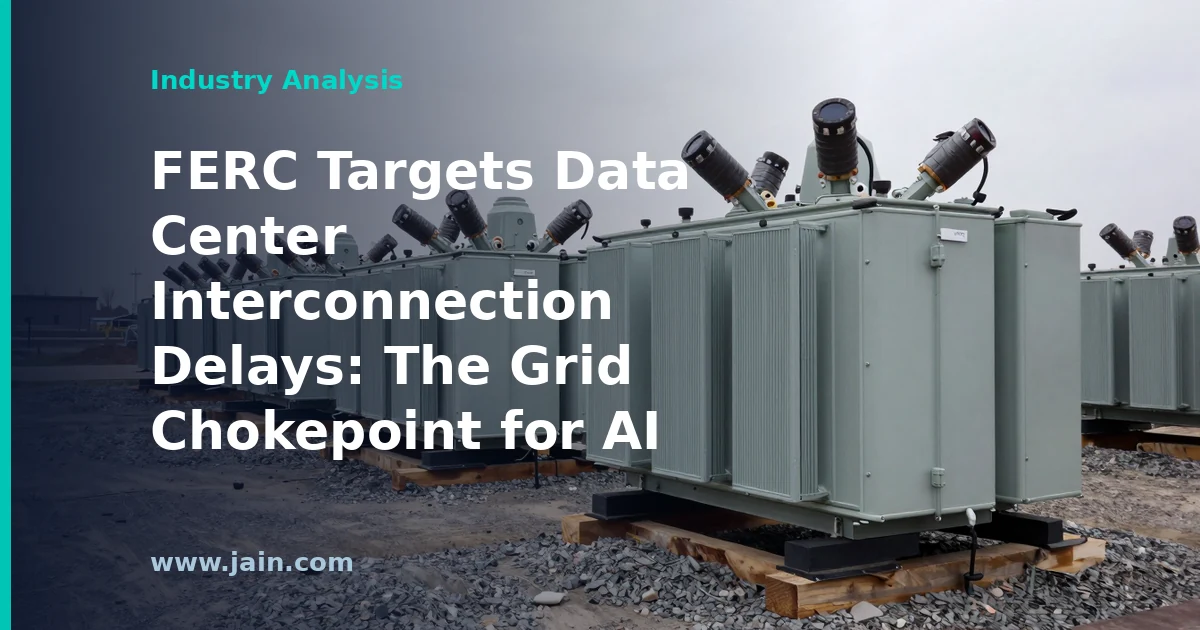
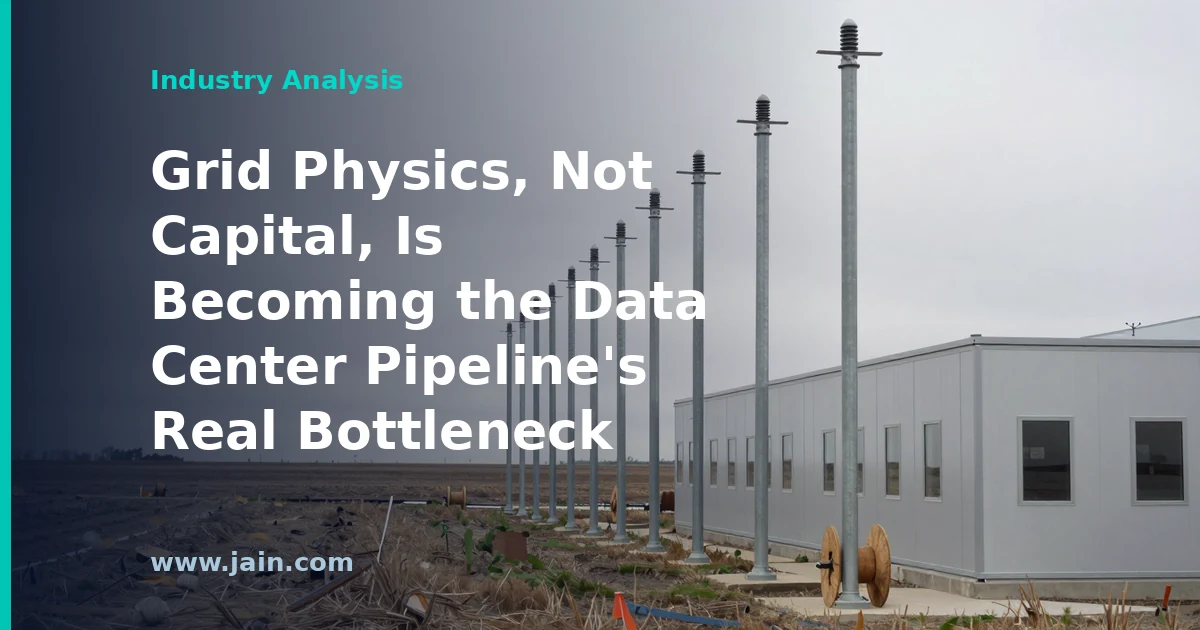
The Federal Energy Regulatory Commission (FERC) — the U.S. agency that oversees interstate electricity transmission and wholesale power markets — is taking aim at the delays data centers face when connecting to the power grid, according to a May 11, 2026 report from Broadband Breakfast. Interconnection, the formal process by which a large new electricity load or generator gets studied and physically wired into the transmission system, has become one of the tightest bottlenecks in the AI infrastructure buildout.
Executive Summary
According to the report, FERC is targeting the interconnection delays that have left large data center projects waiting — often years — for grid connections. The report available to us is brief and does not detail the specific mechanism, so it is not yet clear whether the action takes the form of a rulemaking, an order directed at grid operators, or a preliminary inquiry. What is clear is the direction: the federal regulator most responsible for transmission access is treating data center connection timelines as a problem worth its attention.
Why it matters: capital, chips, and land have largely stopped being the binding constraints on AI data center construction — power is. A hyperscale campus can be financed and built in two to three years, but securing a firm grid connection can take longer than that in constrained regions. Any FERC move that compresses those timelines, or that standardizes how utilities and regional grid operators study large new loads, goes directly to the pace at which announced AI capacity actually energizes.
The Queue Is the Chokepoint
For most of the grid’s history, interconnection processes were designed around new power plants, not new consumers. A data center drawing hundreds of megawatts — comparable to a small city — inverts that model: it is a load so large that utilities must run detailed studies to confirm the transmission system can serve it without destabilizing service to everyone else. Those large-load studies are handled inconsistently across the country, often utility by utility, with no uniform federal timeline. The result is a patchwork in which functionally identical projects can face wait times that differ by years depending on jurisdiction.
FERC has already spent years reforming the generator side of this problem — its Order 2023 overhauled generator interconnection queues with clustered, first-ready-first-served studies after backlogs stretched to multi-year waits. The load side, where data centers sit, has had no equivalent national framework. FERC has also been drawn into adjacent fights, most visibly over co-location arrangements that would place data centers directly at existing power plants, a structure that raised contested questions in the PJM region about who pays for the grid and who gets access to scarce capacity. An action targeting data center interconnection delays fits a pattern of the Commission being pulled, docket by docket, into the collision between AI demand growth and grid process.
What Federal Action Can and Cannot Fix
FERC’s leverage is real but bounded. It regulates interstate transmission and the regional grid operators (RTOs and ISOs) that administer most of the U.S. bulk power system, so it can standardize study timelines, impose deadlines, and clarify cost responsibility for network upgrades. That could meaningfully shrink the procedural portion of interconnection delays — the months lost to sequential studies, restudies, and ambiguity about process.
What FERC cannot conjure is physical capacity. Where delays reflect genuinely constrained transmission — lines and transformers that do not yet exist — faster paperwork simply delivers a faster “no” or a large upgrade bill. Transformers and high-voltage equipment carry their own multi-year supply lead times, and retail-level service decisions remain with states and local utilities. The honest framing is that federal reform can remove artificial delay, not engineering reality; both matter, and the report available does not indicate which FERC believes is dominant.
Winners, Losers, and the Cost Question
Faster, more predictable interconnection most benefits large, well-capitalized developers — hyperscalers and major colocation operators — who can meet readiness requirements and post financial commitments quickly. It also benefits regions competing for data center investment, where interconnection uncertainty has begun steering projects toward states or utilities perceived as faster. Utilities face a more mixed picture: standardized deadlines add pressure and potential liability, but a clearer process also protects them from accusations of arbitrary treatment.
The hardest question any reform must answer is cost allocation: when a multi-hundred-megawatt load triggers transmission upgrades, does the data center pay, or do those costs spread across all ratepayers? Consumer advocates have pressed this issue sharply as residential bills rise in data-center-heavy regions, and it was central to the co-location disputes FERC has already handled. A reform that accelerates connections without settling who pays would relocate the fight rather than resolve it — and that question deserves scrutiny regardless of which side raises it.
Background
FERC’s involvement in the data center power crunch has been building for several years. U.S. electricity demand, flat for roughly two decades, began rising sharply in the mid-2020s as AI training and cloud workloads drove a wave of hyperscale construction, and grid operators repeatedly raised their load forecasts in response. The Commission modernized generator interconnection with Order 2023, but large consuming loads had no comparable national framework, leaving data centers subject to a patchwork of utility-specific processes. FERC was also pulled into high-profile disputes over co-locating data centers at power plants, which crystallized the cost-allocation and market-access questions that any broader interconnection reform will have to answer. Action targeting data center connection delays is the logical next step in that progression.
The North American Electric Reliability Corporation (NERC) — the regulatory body responsible for the reliability of the bulk power system in the United States and Canada — has issued a warning that the rapid growth of data-center electricity demand risks overtaxing the grid, according to reporting by Latitude Media published May 3, 2026. The alert places the AI-driven data-center build-out squarely among the leading reliability risks facing the North American power system.
Executive Summary
NERC is not a trade group or an advocacy organization: it is the FERC-certified Electric Reliability Organization whose standards are mandatory and enforceable for grid operators across North America. When NERC elevates a risk, utilities, regional transmission organizations, and regulators are expected to respond. The reported warning frames unchecked data-center load growth — the wave of large, concentrated electricity demand from AI and cloud facilities — as a material threat to grid reliability, not merely a planning challenge.
The significance lies less in the observation itself, which grid planners have discussed for several years, than in the messenger and the framing. Reliability warnings from NERC historically precede changes in interconnection rules, resource-adequacy requirements, and planning standards. For data-center developers and their customers, that means the era of assuming the grid will simply absorb new campus-scale loads is closing, and the terms of grid access are likely to tighten.
Why the Messenger Matters More Than the Message
Grid strain from data centers is not a new story — utilities in Virginia, Texas, Georgia, and elsewhere have reported unprecedented interconnection queues for years, and NERC’s own long-term reliability assessments have repeatedly flagged accelerating demand growth after two decades of roughly flat US electricity consumption. What changes when NERC issues a pointed warning is the institutional weight behind it. NERC’s assessments feed directly into how utilities justify infrastructure spending before state regulators and how regional grid operators set reserve requirements — the buffer of spare generating capacity kept available for peak conditions.
A reliability warning of this kind typically functions as a forcing mechanism. It gives utilities cover to demand stricter commitments from large-load customers, gives regulators grounds to scrutinize speculative interconnection requests, and gives grid operators justification to slow or condition approvals. The practical effect is that a NERC alarm tends to translate, over the following quarters, into new rules rather than remaining rhetoric.
The Core Problem: Speed, Scale, and Concentration
Data-center load is difficult for grid planners for three compounding reasons. First is speed: a large data-center campus can be built in two to three years, while new high-voltage transmission lines and large power plants routinely take seven to ten years to permit and construct. Second is scale: modern AI campuses request power in the hundreds of megawatts — a single facility can draw as much electricity as a mid-sized city. Third is concentration: developers cluster where fiber, land, and power intersect, so the demand lands on a handful of regional grids rather than spreading evenly across the country.
There is also a planning-data problem that reliability bodies have wrestled with publicly: developers frequently submit interconnection requests to multiple utilities for the same project, a practice sometimes called phantom load. Grid planners cannot easily distinguish which requests represent real, committed demand, which makes forecasting — the foundation of reliability planning — genuinely harder. A warning about “unchecked” growth is, in part, a warning about growth that planners cannot see clearly.
Winners, Losers, and the Coming Rule Changes
If NERC’s warning hardens into policy, the likely instruments are familiar: stricter financial commitments and deposits for interconnection requests, minimum-take or ramp-schedule contracts for large loads, requirements for on-site or contracted generation, and curtailment provisions that let grid operators reduce a data center’s draw during system emergencies. Each of these shifts risk from ratepayers and the grid back onto the load itself.
The relative winners in that world are developers who already control their power story — those with signed long-term supply agreements, on-site generation, flexible-load capability, or sites in regions with surplus capacity. Speculative developers banking on cheap, unconditional grid access face longer timelines and higher costs. Utilities gain leverage but also face a genuine dilemma: overbuild for demand that may not materialize and ratepayers foot the bill, or underbuild and reliability suffers. That asymmetry is precisely why an independent reliability body raising the flag matters — it pushes the debate from utility earnings calls into the formal reliability-standards process.
What a Reliability Warning Does Not Say
It is worth being precise about what a warning like this does and does not establish. It does not mean blackouts are imminent, and it does not assign blame to any individual company or project. Reliability risk is probabilistic: it means the margin between available supply and projected peak demand is narrowing faster than infrastructure is being added, raising the odds of emergency measures during extreme conditions. Nor does the warning settle the policy question of who should pay for grid upgrades — that fight is playing out state by state in rate cases and large-load tariff proceedings, and NERC’s role is to describe the risk, not to allocate its costs.
Background
NERC was formed in 1968 after the 1965 Northeast blackout and became the enforceable Electric Reliability Organization for the United States under the Energy Policy Act of 2005, with the Federal Energy Regulatory Commission (FERC) as its overseer. It publishes seasonal and long-term reliability assessments that grid operators and utilities treat as authoritative, and in recent years those assessments have tracked a historic shift: after two decades of essentially flat US electricity demand, consumption is rising again, driven by AI and cloud data centers, manufacturing reshoring, and electrification.
Data centers sit at the center of that shift because their demand is large, fast-arriving, and geographically concentrated, while the transmission and generation needed to serve them move on much slower permitting and construction timelines. The May 2026 warning reported by Latitude Media extends a line of increasingly direct statements from reliability authorities that the gap between load growth and infrastructure build-out is itself becoming a systemic risk.
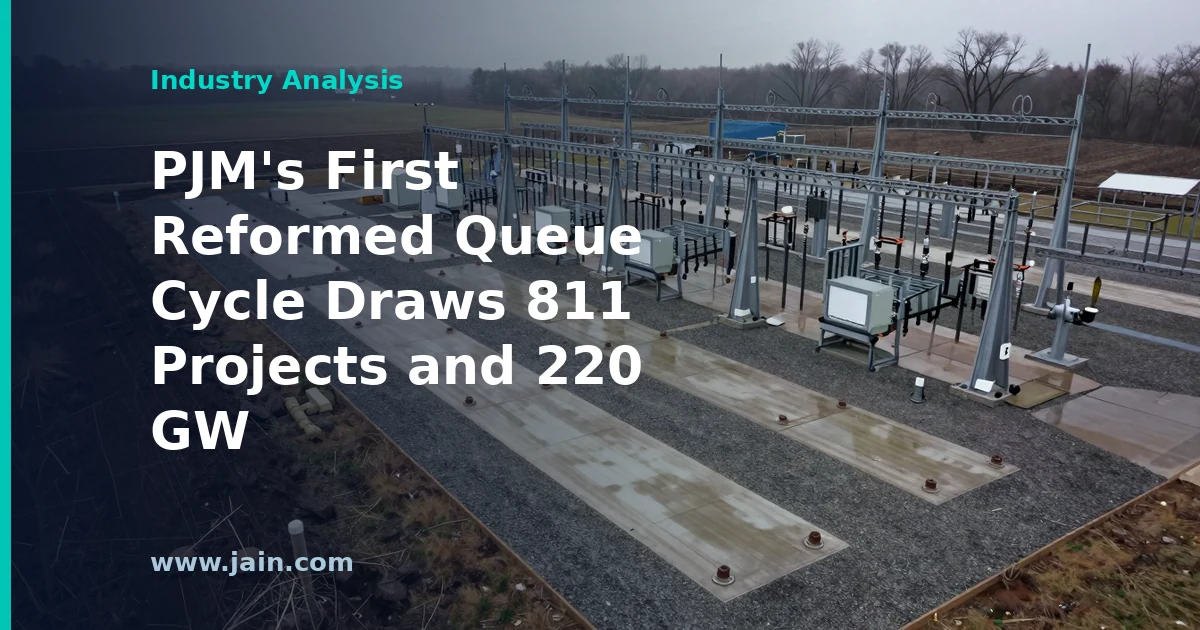
PJM Interconnection, the grid operator for the largest wholesale electricity market in the United States, has closed the application window for the first cycle of its reformed interconnection queue with 811 project applications totaling roughly 220 gigawatts (GW) of proposed capacity, according to an April 30, 2026 report in POWER Magazine. The interconnection queue is the formal process through which new power plants, storage facilities, and other resources apply to connect to the high-voltage grid.
The cycle is the first to run entirely under PJM’s overhauled “first-ready, first-served” cluster study rules, replacing the serial, first-come-first-served process that had produced multiyear backlogs.
Executive Summary
The headline numbers are striking on their own terms: 811 projects and about 220 GW of proposed capacity entered a single study cycle — a volume on the same order as the entire existing generating fleet serving PJM’s 13-state-plus-D.C. footprint. That developers are willing to post the deposits and demonstrate the site control the reformed process demands, at that scale, is a concrete market signal rather than a speculative one.
The timing matters. PJM has spent recent years warning of tightening supply as older plants retire while demand — led by AI and data center load growth concentrated in places like Northern Virginia — climbs after decades of flat consumption. A deep pipeline of proposed generation is the necessary first step toward closing that gap.
The essential caveat is that a queue application is not a power plant. Historically, only a fraction of projects that enter U.S. interconnection queues ever reach commercial operation, and the reformed process is designed to study projects faster, not to guarantee they get financed and built. The 220 GW figure measures developer appetite and process throughput — not committed steel in the ground.
A 220-GW Referendum on Electricity Demand
For most of the 2010s, U.S. electricity demand was essentially flat, and grid planning was an exercise in managing retirements and replacement. The 220 GW that flowed into PJM’s first reformed cycle reflects a different era: hyperscale data centers, AI training and inference clusters, electrified transport, and reshored manufacturing have turned load growth from a rounding error into the central planning problem in the nation’s largest power market.
Because the reformed process requires real financial commitments and demonstrated site control up front, this cycle’s volume is a cleaner demand signal than the old queue ever provided. Under the prior serial process, speculative placeholder projects could sit in line for years at little cost, inflating queue totals. A 220-GW cycle under stricter entry rules suggests developers see durable, creditworthy demand — much of it from data center operators willing to sign long-term commitments — rather than a bubble of free options.
What Queue Reform Fixed — and What It Cannot
PJM’s old process studied projects one at a time in the order they arrived, so a single stalled or withdrawn project could force costly restudies of everyone behind it. The reformed approach, approved by federal regulators as part of a broader national shift toward cluster studies, batches projects into cycles, studies them together, and allocates shared network-upgrade costs across the group. Projects that are not ready — lacking land rights or deposits — are filtered out early instead of clogging the line.
What reform cannot do is build anything. Study speed is only one bottleneck among several: transformer and switchgear lead times remain long, skilled-labor markets are tight, local permitting is contested, and network upgrade costs identified in cluster studies can still kill marginal projects. The queue’s completion rate — nationally, often cited at roughly one in five projects historically — is the number that ultimately matters, and this announcement tells us nothing about it yet.
Winners, Losers, and the Shape of the Pipeline
The reformed rules structurally favor well-capitalized developers who can post deposits, secure land early, and absorb study-phase risk — utilities, large independent power producers, and infrastructure-fund-backed platforms. Smaller and more speculative developers, who thrived under the low-cost old queue, face a higher bar. That consolidation cuts both ways: it should raise the fraction of queued projects that actually get built, but it also concentrates the development pipeline in fewer hands.
For large power buyers — data center operators above all — a deep, better-qualified queue is medium-term good news, since it is the raw material for future supply. But the near-term picture is unchanged: projects entering study now are years from commercial operation, so tight capacity conditions and elevated prices in PJM are likely to persist until this pipeline starts delivering. The gap between when demand arrives and when supply can physically connect remains the defining tension in the market.
Background
PJM traces its roots to 1927, when utilities in Pennsylvania and New Jersey first pooled their generation, and it has grown into the largest wholesale power market in North America. In the early 2020s its interconnection queue became a symbol of national gridlock: thousands of projects languished in a serial study process while wait times stretched toward half a decade, prompting a federally approved overhaul that paused new entries while PJM worked through the backlog and transitioned to clustered, readiness-based study cycles.
The reform arrives just as PJM’s supply-demand balance has tightened. Plant retirements, sharply rising data center load, and record-setting capacity market results have made the pace of new generation buildout the market’s defining question — which is why the volume of this first reformed cycle is being read as a bellwether well beyond PJM’s borders.
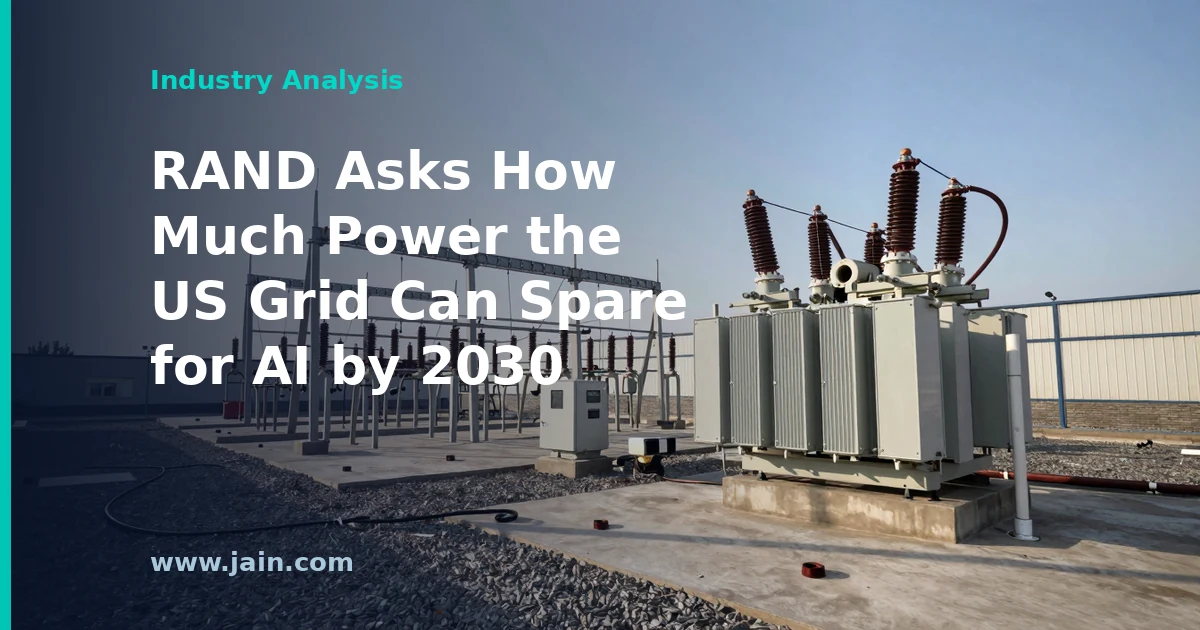
On April 28, 2026, RAND — the nonprofit, nonpartisan policy research institution — published an analysis titled “How Much More Power Can the U.S. Grid Provide for AI? Projections and Policy Implications for 2030.” The work models the gap between surging AI-driven electricity demand and the grid’s realistic ability to serve it this decade, and maps the policy choices that will widen or narrow that gap.
Executive Summary
The question in RAND’s title is arguably the central resource question of the AI buildout. Data centers running artificial-intelligence workloads have become one of the fastest-growing sources of new electricity demand in the United States, and every hyperscale campus announcement ultimately depends on an answer to the same question: can the grid actually deliver the power, and by when?
What makes a RAND treatment notable is the framing. Rather than starting from what AI developers say they need — the demand-side forecasts that dominate industry discourse — the title starts from what the grid can provide, a supply-side constraint analysis. Pairing “projections” with “policy implications” signals that the answer is not a fixed number but a range whose outcome depends on decisions about generation, transmission, and interconnection that federal and state policymakers are making right now.
Because our source is the publication listing rather than the full report, this article analyzes the question RAND is posing and the market context around it, and flags below what the listing alone does not tell us about the report’s specific findings.
Why the Supply-Side Framing Matters
Most public numbers in the AI-power debate come from the demand side: forecasts of how many gigawatts AI data centers will request. Those forecasts are genuinely uncertain — utilities have reported that the same prospective data center project often applies for service in multiple territories, which can inflate aggregate demand figures if requests are summed naively. A supply-side analysis flips the question to the binding constraint: how much new load the existing fleet of power plants, transmission lines, and distribution infrastructure can absorb by 2030 under realistic buildout assumptions.
That reframing matters commercially. If credible headroom estimates exist region by region, they become a de facto siting map — telling developers where power is available and telling investors which announced projects face energization risk. It also disciplines the conversation: a project announcement is not capacity until a utility can serve it.
The Bottleneck Is Delivery, Not Just Generation
For readers new to the topic: connecting a large new power plant or a large new customer to the grid requires an engineering study process called interconnection, and in much of the country those study queues have stretched to multiple years. High-voltage transmission lines — the long-distance wires that move bulk power — routinely take the better part of a decade from proposal to operation because they cross many permitting jurisdictions. Meanwhile, a modern AI campus can be requesting hundreds of megawatts, the scale of a small city, on a two-to-three-year construction schedule.
That timing mismatch, not any absolute shortage of energy resources, is the crux of the 2030 question. It explains why data center operators are increasingly pursuing workarounds: siting at retired industrial locations with existing grid connections, contracting directly with power plants, adding on-site generation, and offering demand flexibility — agreeing to reduce draw during grid stress in exchange for faster hookups.
The Policy Levers on the Table
The “policy implications” half of RAND’s title points at a live agenda. The levers most commonly debated in this space include: reforming interconnection queues so viable projects move faster; accelerating transmission permitting and cost allocation; deciding who pays for grid upgrades triggered by large loads, a question with direct consequences for other ratepayers’ bills; and setting rules for large flexible loads and behind-the-meter generation. Each lever sits with a different actor — federal regulators, regional grid operators, state commissions — which is why national demand projections translate so unevenly into local reality.
For the infrastructure industry, the stakes cut both ways. Faster interconnection and transmission buildout expands the addressable market for data center development. But cost-allocation decisions that shift upgrade costs onto large loads change project economics, and jurisdictions that move slowly will simply watch capacity — and the tax base that comes with it — land elsewhere. An evenhanded, nonpartisan modeling effort that quantifies these tradeoffs is useful precisely because most numbers in circulation come from parties with a commercial or advocacy position.
Background
US electricity demand was roughly flat for about two decades before data centers — accelerated sharply by the generative AI boom that began in late 2022 — joined electrification and reshored manufacturing in pushing load growth back onto utility planning agendas. Since then, hyperscale campus announcements measured in the hundreds of megawatts or more have become routine, and access to power has displaced land and fiber as the primary siting constraint for the data center industry.
RAND, founded in 1948, is a nonprofit research institution known for quantitative analysis of defense, infrastructure, and technology policy. Its entry into the AI-and-grid debate adds an independent modeling voice to a discussion otherwise dominated by utilities, developers, and advocacy groups, each with a stake in how big the numbers are said to be.
Latitude Media reports that the physical realities of the electric grid are “setting in” for the data center development pipeline. The April 26, 2026 piece frames a shift the industry has been circling for two years: the constraint on new AI-driven data center capacity is increasingly not capital, land, or chips, but whether the grid can physically deliver the power — and how long interconnection and transmission upgrades take.
Executive Summary
The report’s core observation is that the announced data center pipeline — the sum of projects developers have declared — is colliding with what the transmission system can actually serve. Interconnection (the formal process of connecting a large new load or generator to the grid) and transmission capacity (the physical ability of high-voltage lines to move power to a given location) operate on utility timescales measured in years, while hyperscale demand has been announced on timescales measured in quarters.
Why it matters: if grid physics is the binding constraint, then the familiar metrics of the buildout — megawatts announced, acres acquired, capital committed — stop predicting what actually gets energized and when. Siting strategy shifts from “where is land and fiber” to “where is deliverable power,” and the advantage moves to players who secured interconnection positions early or who can bring their own generation.
Announced Megawatts Are Not Energized Megawatts
A recurring pattern in this cycle is the gap between the announced pipeline and deliverable capacity. A developer can buy land, order equipment, and issue a press release in months; a utility must study the new load’s effect on the surrounding network, plan any needed substation and transmission upgrades, and build them — a sequence that routinely runs on multi-year timelines. The Latitude Media framing, that physical realities are “setting in,” suggests the market is starting to discount announcements accordingly. For readers of industry news, the practical takeaway is to treat energization dates, not announcement dates, as the real milestone.
Why Transmission Is the Hard Constraint
Transmission is unforgiving because it is physics plus process. Physically, a high-voltage line can carry only so much power before thermal and stability limits bind, and a concentrated gigawatt-scale load changes flows across an entire region, not just one feeder. Procedurally, upgrades require engineering studies, regulatory approvals, cost-allocation fights over who pays, and often new rights-of-way. None of these steps compresses easily with money. That is what distinguishes this bottleneck from earlier ones like GPU supply or land: you cannot pay a premium to make load-flow studies and line construction happen in a quarter.
Winners: Whoever Holds Deliverable Power
If interconnection position is the scarce asset, several groups benefit. Incumbent data center operators with existing utility relationships and already-energized capacity hold something new entrants cannot quickly replicate. Sites with surplus deliverable power — including brownfield industrial locations with legacy grid infrastructure — gain value relative to greenfield land. And “bring your own power” strategies, from on-site generation to co-location with existing plants, move from novelty to mainstream consideration, though they introduce their own permitting, fuel, and regulatory questions. Conversely, late-arriving developers whose projects sit deep in interconnection queues face the risk that their capacity arrives after the demand it was meant to serve has been placed elsewhere.
The Siting Map Is Being Redrawn
For two decades, data center geography followed fiber routes, tax incentives, and cheap land. A grid-constrained era redraws that map around electrical headroom: regions with spare transmission capacity, faster-moving utilities, or generation-rich locations become competitive even without a legacy data center cluster. This also raises a policy dimension — utilities and regulators must decide how much speculative load to plan for, and how to protect other ratepayers from paying for infrastructure serving projects that may not materialize. How that risk gets allocated will shape which regions court this demand and which slow-walk it.
Background
Data center development historically treated electricity as a routine input: sites were chosen for fiber connectivity, land cost, and tax treatment, and utilities absorbed the load growth without drama. The AI buildout that accelerated from 2023 onward broke that assumption, with individual campuses proposed at power levels comparable to heavy industry and developers announcing capacity far faster than grid infrastructure has historically been built.
By 2026 the conversation across the industry had shifted from chip supply and capital availability to power delivery — interconnection queues, transformer and equipment lead times, and transmission planning. The Latitude Media piece discussed here sits in that context: an energy-sector publication documenting the moment when the announced pipeline meets the grid’s physical and procedural limits.
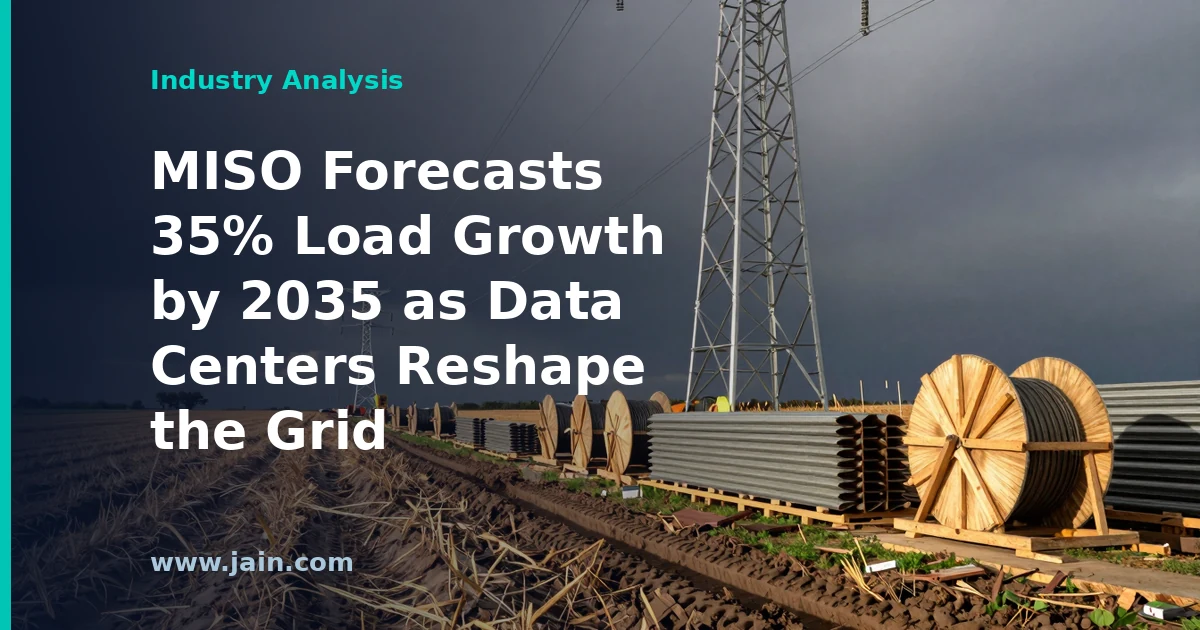
The Midcontinent Independent System Operator (MISO) — the grid operator coordinating electricity across a footprint spanning 15 U.S. states and the Canadian province of Manitoba — expects electric load to jump roughly 35% by 2035, according to an April 2026 report from Utility Dive. The primary driver named in the forecast is data center growth.
A 35% increase over roughly a decade represents a dramatic break from the era of essentially flat U.S. electricity demand that prevailed from the late 2000s through the early 2020s, and it puts one of the largest grid operators in North America on record quantifying the scale of the AI-and-cloud buildout.
Executive Summary
MISO’s forecast is a planning document, not a press release from a company selling something — which makes it one of the more consequential data points in the ongoing debate over how much electricity the data center boom will actually consume. Regional transmission organizations (RTOs) like MISO exist to keep supply and demand balanced in real time and to plan the wires and generation needed years ahead. When an RTO raises its ten-year demand outlook by more than a third, that number flows directly into transmission planning, capacity auctions, and the resource plans of dozens of utilities.
The significance is twofold. First, it validates what individual utilities across the Midwest and Gulf South have been reporting piecemeal: hyperscale data center projects are arriving in interconnection queues at a pace with no modern precedent. Second, it sets up a decade of hard trade-offs. Meeting 35% growth requires new generation, new transmission, and new large-load interconnection rules — all on timelines that historically run slower than the two-to-three-year construction schedule of a data center campus.
For the infrastructure industry, the headline number is both an opportunity signal and a warning: the grid is now the binding constraint on digital infrastructure growth, and the regions that solve power delivery fastest will win the next wave of siting decisions.
The End of Flat Demand Is Now Official Planning Doctrine
For roughly fifteen years, U.S. grid planners could assume that efficiency gains — LED lighting, better HVAC, industrial offshoring — would offset economic growth, keeping total electricity demand nearly flat. That assumption underpinned everything from utility rate cases to power plant retirement schedules. A 35% load-growth forecast from MISO formally retires it for one of the largest grid footprints in North America.
What makes an RTO forecast different from a consultant’s projection is accountability: MISO must plan transmission and resource adequacy against this number. If the forecast is right and the buildout lags, the result is capacity shortfalls and price spikes. If the forecast is wrong and infrastructure is overbuilt, ratepayers carry stranded costs. Either error is expensive, which is why the assumptions behind the number — how much announced data center load actually materializes — deserve as much scrutiny as the number itself.
Data Centers as the Marginal Buyer of Power
A data center is, from the grid’s perspective, an unusual customer: it demands large blocks of power (often hundreds of megawatts per campus), runs at high utilization around the clock, and wants to connect years faster than traditional industrial load. When such customers become the dominant source of demand growth, they effectively set the terms of grid expansion — and grid operators, utilities, and regulators are still working out who pays for the upgrades those connections require.
The economics cut in several directions. Utilities in MISO territory gain a growth story they have not had in a generation, which supports investment in wires and generation. Existing ratepayers face the risk of subsidizing infrastructure built for loads that may not fully arrive — a concern regulators in several states are already addressing through special large-load tariffs and financial-commitment requirements. Data center developers, meanwhile, face the reality that power availability, not land or fiber, now determines where and when they can build.
Winners, Losers, and the Speed Mismatch
The core tension in a 35%-by-2035 scenario is timing. Gas turbines face multi-year order backlogs, new nuclear operates on decade-plus horizons, and large transmission projects routinely take seven to ten years from planning to energization. Data center campuses go from groundbreaking to load in two or three. That mismatch favors whoever can bridge it: developers with early interconnection positions, utilities with spare capacity or fast-track large-load processes, suppliers of grid equipment, and operators pursuing on-site or co-located generation.
It also raises competitive stakes between regions. MISO’s footprint — stretching from the upper Midwest to the Gulf Coast — competes with PJM, ERCOT, and the Southeast for hyperscale siting. A credible, well-executed plan to serve 35% more load is itself an economic-development asset; a forecast without matching buildout is a queue of frustrated customers who will site elsewhere.
Forecast Versus Reality: The Phantom Load Question
Every load forecast in the current environment must grapple with duplicate and speculative requests. Developers commonly file interconnection requests in multiple jurisdictions for the same project, and some announced campuses will never be built. Grid operators know this and apply screening assumptions, but the industry has little historical data on what fraction of AI-era announced load converts to actual consumption. The honest read of any 35% figure is that it is a planning scenario with meaningful uncertainty in both directions — actual growth could undershoot if projects evaporate, or overshoot if AI demand keeps compounding.
That uncertainty is not a reason to dismiss the forecast; it is a reason to watch how MISO and its member utilities structure commitments. Mechanisms that require large customers to put capital at risk — minimum-take contracts, collateral requirements, contribution to network upgrades — are the market’s way of separating real load from phantom load, and their adoption across the footprint will be a better indicator of true demand than any single projection.
Background
MISO was founded in 1998 and became the first FERC-approved regional transmission organization in the United States in 2001. It coordinates generation and high-voltage transmission across a footprint stretching from the upper Midwest down through the Gulf South, serving tens of millions of people through its member utilities. Like other RTOs, it does not own power plants or lines; it operates markets and plans the system that its members build.
The forecast arrives amid a broader U.S. re-acceleration of electricity demand after more than a decade of stagnation, driven by AI and cloud data center construction, manufacturing reshoring, and electrification. Grid operators across the country have been revising load outlooks upward repeatedly since the early 2020s, and interconnection queues for both large loads and new generation have swelled to historic levels — making forecasts like this one central to the industry debate over how much of the announced boom is real.