


On September 01, 2026, traders in the options market showed a cautious stance on Nebius Group NV (NASDAQ: NBIS) as the stock price declined by $5.75 to approximately $200.56. The options activity revealed a slight skew toward downside protection, reflecting growing investor concern about near-term risks.
- NBIS’s current Price-to-Sales (P/S) ratio stands at 43.4, vastly exceeding its historical median of 6.8 and the industry median, signaling that the market is pricing in aggressive future growth; earnings-based valuation metrics like P/E are not applicable due to the company’s unprofitable and cash-flow-negative status.
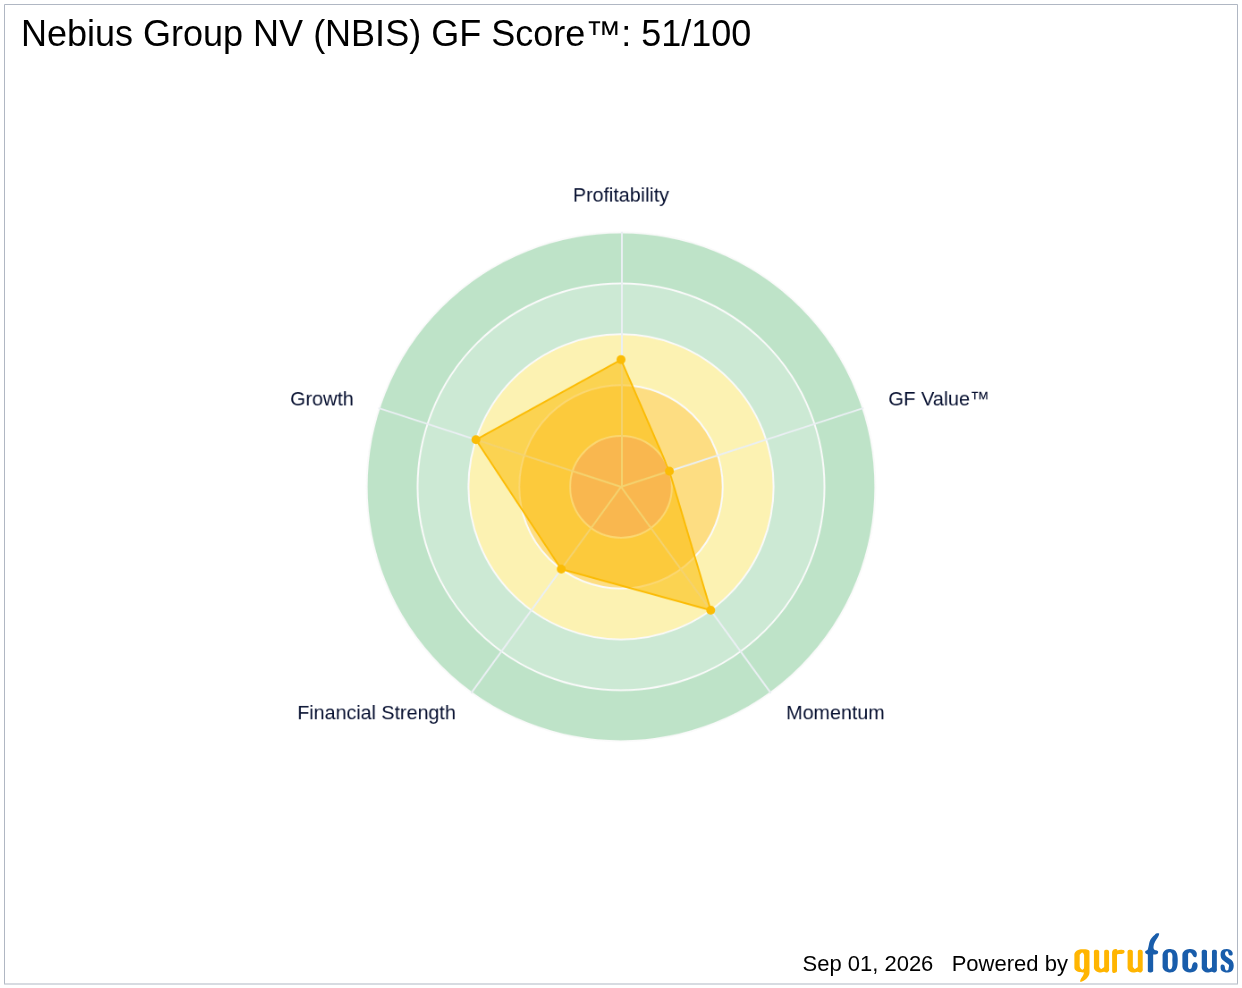
- The company’s GF Score™ is 51 out of 100, indicating a moderate overall fundamental health with notable strengths in growth and momentum but weaknesses in valuation and financial strength.
- Insider activity over the past 12 months shows significant net selling, with insiders offloading $171.5 million worth of shares and no insider purchases reported, contrasting with steady guru 13F ownership where 8 gurus hold NBIS, with 7 adding and 2 trimming positions recently.
What's Behind the News?
The recent drop in NBIS’s stock price and the elevated put/call ratio of 1.08—above the typical 0.92 average—highlight a cautious sentiment among options traders. The total options volume of 119,000 contracts was relatively muted, but the preference for put options suggests investors are increasingly seeking downside protection. Additionally, the 30-day implied volatility rose by 0.7 points to 78.16, still within the lowest 10% range over the past year, implying an expected daily price swing of about $9.87. This combination of factors points to a market anticipating some near-term volatility despite the company’s strong long-term growth narrative.
Nebius Group NV operates in the Communication Services sector within the Interactive Media industry. It is a vertically integrated cloud provider specializing in AI and high-performance computing. Originating as a carve-out from the former Russian tech giant Yandex due to geopolitical sanctions, Nebius now runs its own data centers and servers across Europe and the United States, with a capacity spanning several hundred megawatts. The company’s market capitalization stands at $54.40 billion, underscoring its significant scale. A major milestone was achieved in September 2025 when Microsoft signed a multiyear $17 billion agreement to utilize Nebius’s computing capacity, reinforcing its position in the cloud infrastructure market.
Is NBIS Overvalued on a Price-to-Sales Basis?
Nebius Group NV’s current Price-to-Sales ratio of 43.4 is extraordinarily high compared to its historical median of approximately 6.8 and far above typical industry levels. This elevated P/S ratio suggests that investors are pricing in substantial future revenue growth and market expansion. Given the company’s unprofitable status—with a negative trailing twelve months (TTM) EPS of -0.06 and negative free cash flow margins—traditional earnings-based valuation metrics such as the P/E ratio are not meaningful for NBIS. The market’s focus is therefore on top-line growth potential rather than current profitability.
While the GF Value™ metric cannot provide a reliable fair value estimate for NBIS due to its loss-making and cash-flow-negative profile, it serves as a directional caution. The absence of a GF Value™ figure here underscores the difficulty in applying standard valuation models to companies in rapid growth phases but lacking earnings. For more details on GF Value™, see GF Value™ for NBIS.
What Does NBIS's GF Score™ Tell Us?
The GF Score™ is a composite measure designed to evaluate a company’s overall financial health, growth prospects, profitability, valuation, momentum, and balance sheet strength. NBIS’s GF Score™ of 51 out of 100 reflects a middling fundamental profile with uneven strengths and weaknesses.
| Metric | Rating (out of 10) |
|---|---|
| GF Score™ | 51 |
| Financial Strength | 4 |
| Profitability | 5 |
| Growth | 6 |
| Valuation | 2 |
| Momentum | 6 |
NBIS’s strongest areas lie in growth and momentum, consistent with its rapid revenue expansion (3-year revenue growth of 286.7%) and recent price momentum despite short-term volatility. However, its valuation rank is notably weak, reflecting the market’s premium pricing relative to fundamentals. Financial strength is also a concern, with an Altman Z-Score of 2.49 placing the company in a grey zone for financial stress and a Beneish M-Score suggesting possible earnings manipulation. Profitability remains challenged with negative operating margins and free cash flow. Investors should weigh these mixed signals carefully. For further details, visit the NBIS stock page.
What Are Gurus and Insiders Doing with NBIS?
GuruFocus tracks 8 premium gurus currently holding NBIS, with 7 increasing their stakes and 2 trimming positions in recent quarters. This net positive guru buying activity signals continued institutional confidence in the company’s long-term prospects, distinguishing NBIS from many peers. In contrast, insider activity over the past 12 months has been exclusively selling, with insiders offloading $171.5 million worth of shares and no insider purchases reported. This divergence between guru accumulation and insider selling may reflect differing perspectives on the company’s near-term risks versus long-term growth potential.
What This Means for Investors
Investors considering NBIS should recognize that the market is currently valuing the company on its future revenue growth potential rather than current profitability or cash flow. The extremely high Price-to-Sales ratio and lack of meaningful earnings metrics mean traditional valuation frameworks do not apply. While institutional guru ownership remains supportive, insider selling activity and moderate financial strength scores advise caution. The GF Score™ of 51/100 encapsulates this mixed fundamental picture. Prospective investors should monitor upcoming earnings and operational developments closely to assess whether NBIS can translate its growth into sustainable profitability. For ongoing updates and detailed financial data, explore the NBIS stock page and the GuruFocus Stock Screener.
Frequently Asked Questions
What is NBIS's GF Score™?
NBIS’s GF Score™ is 51 out of 100, reflecting a moderate overall fundamental profile with strengths in growth and momentum but weaknesses in valuation and financial strength.
Is NBIS overvalued or undervalued?
Based on its Price-to-Sales ratio of 43.4, which far exceeds its historical median and industry norms, NBIS appears overvalued on a sales basis. Earnings-based valuation metrics like P/E are not meaningful due to the company’s unprofitable status.
What is NBIS's P/E ratio compared to historical?
NBIS currently has no meaningful P/E ratio due to negative earnings. Instead, financial strength indicators such as its Altman Z-Score suggest some financial stress, placing it in a grey zone for default risk.
This stock alert was generated using automated technology and GuruFocus financial data to provide readers with timely and accurate market reporting. This content was reviewed by GuruFocus editorial team prior to publication. Please send any questions or comments about this story to [email protected].

