


On August 20, 2026, MARA Holdings Inc (ticker: MARA) saw its shares rise sharply by 10.7%, climbing $1.03 to close at $10.68. This price movement reflects renewed investor interest amid a complex financial backdrop.
- MARA’s current Price-to-Sales (P/S) ratio of 5.32 is below its historical median of 8.49, signaling that the market prices in significant future growth despite the company’s ongoing losses; earnings-based valuation metrics like P/E are not applicable due to persistent unprofitability.
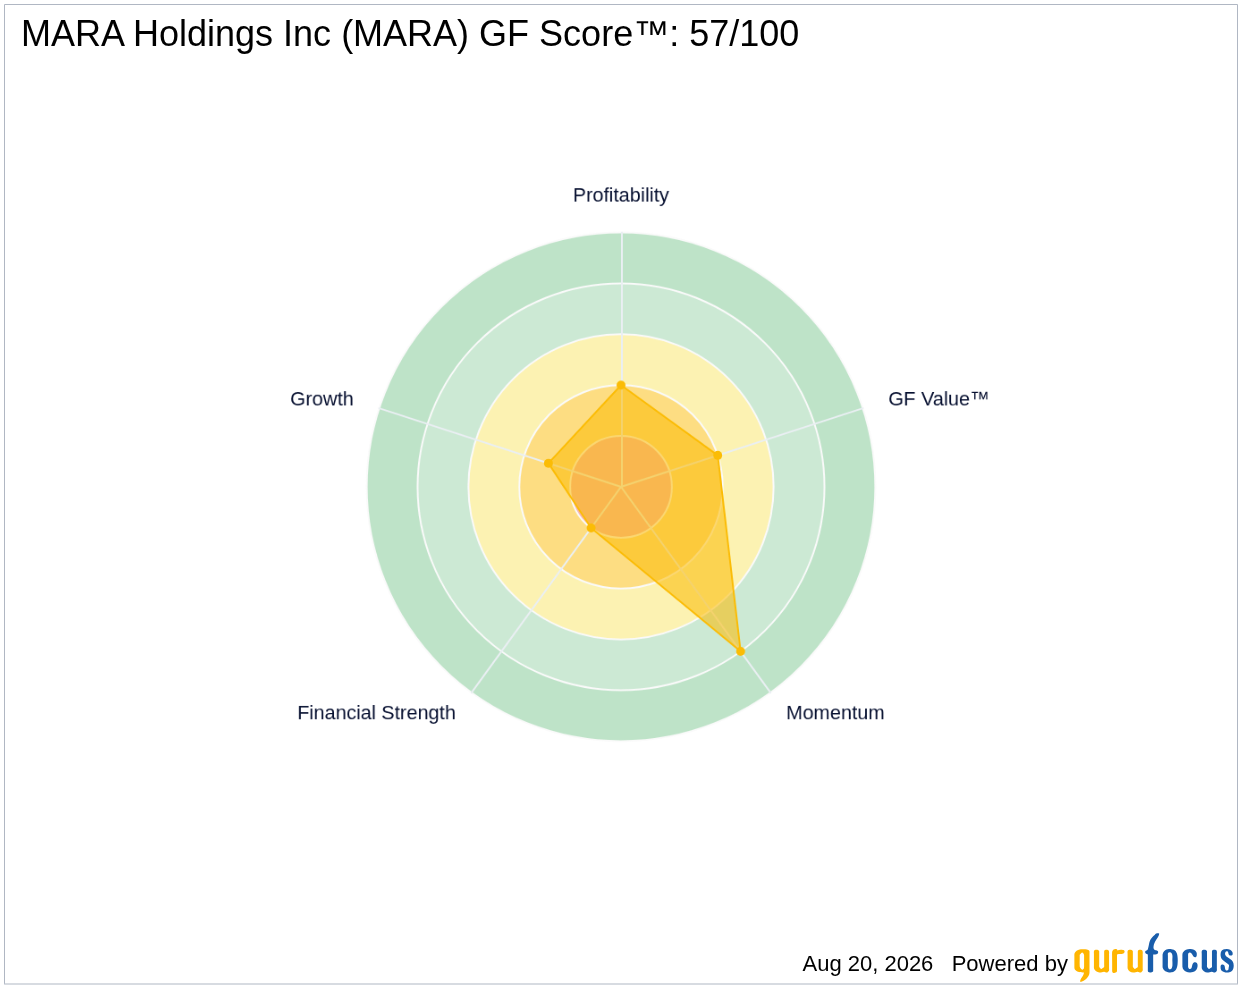
- The company’s GF Score™ stands at 57 out of 100, indicating a moderate overall fundamental health with notable strengths in momentum but weaknesses in financial strength and growth.
- Insider activity reveals no insider buying in the past year, with insiders selling $9.5 million worth of shares, while three premium gurus hold MARA, with two adding and one trimming positions recently—highlighting mixed but engaged institutional interest.
What's Behind the News?
The 10.7% jump in MARA’s share price on August 20, 2026, underscores growing investor enthusiasm despite the company’s challenging financial profile. This surge may be driven by optimism around MARA’s role in the digital asset computing space and its strategic positioning in the energy transformation sector. Investors appear to be betting on the company’s long-term potential to capitalize on blockchain technology and clean energy integration, even as it remains unprofitable and cash-flow negative.
MARA Holdings Inc operates within the Financial Services sector, specifically in the Capital Markets industry. The company leverages digital asset computing to secure blockchain ledgers and supports energy transformation by converting underutilized energy into economic value. It also develops technology solutions such as liquid immersion cooling and firmware for Bitcoin miners. With a market capitalization of $4.09 billion, MARA is a significant player in its niche but faces considerable operational and financial headwinds.
Is MARA Overvalued on a Price-to-Sales Basis?
MARA’s Price-to-Sales ratio currently stands at 5.32, which is notably below its historical median of 8.49 and the industry median of approximately 8.5x. This lower multiple suggests that the market is pricing in slower revenue growth or higher risk compared to MARA’s past performance. Given the company’s persistent losses—reflected in a negative trailing twelve months EPS of -9.16 and operating margins deeply in the red—earnings-based valuation metrics like the P/E ratio are not meaningful here. Investors must therefore rely on sales multiples and forward-looking growth expectations rather than profitability metrics.
The GF Value™ for MARA is $14.96, implying the stock is approximately 29.2% undervalued relative to its current price of $10.60. However, this valuation should be interpreted cautiously. GF Value™ is a proprietary intrinsic value estimate based on historical trading multiples and growth forecasts, which can be unreliable for companies like MARA that are unprofitable and cash-flow negative. Thus, while the GF Value™ signals potential undervaluation, it serves more as a directional warning than a precise fair-value target. For more details, see GF Value™.
What Does MARA's GF Score™ Tell Us?
The GF Score™ aggregates multiple fundamental factors—financial strength, profitability, growth, valuation, and momentum—into a single composite rating that helps investors gauge a company’s overall quality. MARA’s GF Score™ of 57/100 places it in the middle range, reflecting a mixed fundamental profile.
| Metric | Rating |
|---|---|
| GF Score™ | 57 |
| Financial Strength | 2/10 (Poor) |
| Profitability | 4/10 (Below Average) |
| Growth | 3/10 (Weak) |
| Valuation | 4/10 (Modestly Undervalued) |
| Momentum | 8/10 (Strong) |
MARA’s strongest fundamental aspect is momentum, with an 8/10 rating reflecting recent positive price action and investor interest. Conversely, its financial strength is notably weak at 2/10, driven by a high debt-to-equity ratio of 1.49, a distress-level Altman Z-Score of -2.73, and poor liquidity ratios (current and quick ratios both at 0.89). Growth and profitability ranks are also subdued, consistent with negative earnings and operating margins. The valuation rank of 4/10 aligns with the modest undervaluation signaled by GF Value™. For a deeper dive, visit the MARA stock page.
What Are Gurus and Insiders Doing with MARA?
GuruFocus tracks 143 premium gurus, of which three currently hold MARA shares. In recent quarters, two gurus have increased their positions while one has trimmed theirs, indicating a cautiously optimistic institutional stance. This guru ownership data is a key differentiator for GuruFocus, providing insight beyond typical analyst coverage platforms like Simply Wall St or Morningstar.
On the insider front, there has been no insider buying reported in the past 12 months, while insiders have sold $9.5 million worth of shares over the same period. This net insider selling, including nine insider transactions in the past three months with no purchases, may signal a lack of confidence from those closest to the company’s operations.
What This Means for Investors
MARA’s recent price appreciation and modest undervaluation on a P/S basis suggest that the market is pricing in a turnaround or significant future growth in digital asset computing and blockchain-related energy solutions. However, the company’s persistent unprofitability, weak financial strength, and net insider selling temper enthusiasm. The GF Score™ of 57/100 and mixed guru activity underscore a stock that remains speculative and risky. Investors should weigh the potential for growth against the financial distress signals and lack of insider conviction before considering exposure. For ongoing updates and comprehensive data, see the MARA stock page.
Frequently Asked Questions
What is MARA's GF Score™?
MARA’s GF Score™ is 57 out of 100, reflecting a moderate overall fundamental health with strong momentum but weaknesses in financial strength and growth.
Is MARA overvalued or undervalued?
Based on Price-to-Sales, MARA appears modestly undervalued with a current P/S of 5.32 below its historical median of 8.49. Earnings-based valuation metrics like P/E are not meaningful due to the company’s ongoing losses.
What is MARA's P/E ratio compared to historical?
MARA does not have a meaningful P/E ratio as it is unprofitable, with a trailing twelve months EPS of -9.16. Instead, financial strength metrics highlight distress, including a poor Altman Z-Score of -2.73.
This stock alert was generated using automated technology and GuruFocus financial data to provide readers with timely and accurate market reporting. This content was reviewed by GuruFocus editorial team prior to publication. Please send any questions or comments about this story to [email protected].

