

On September 08, 2026, Iris Energy IREN shares surged $3.46, or 7.76%, closing near $48.15 amid heightened options market activity signaling bullish sentiment.
- IREN’s Price-to-Sales (P/S) ratio stands at 23.06, vastly exceeding its historical median of 5.5 and industry norms, reflecting market expectations of substantial future growth; traditional earnings-based valuation metrics like P/E are not applicable due to ongoing losses.
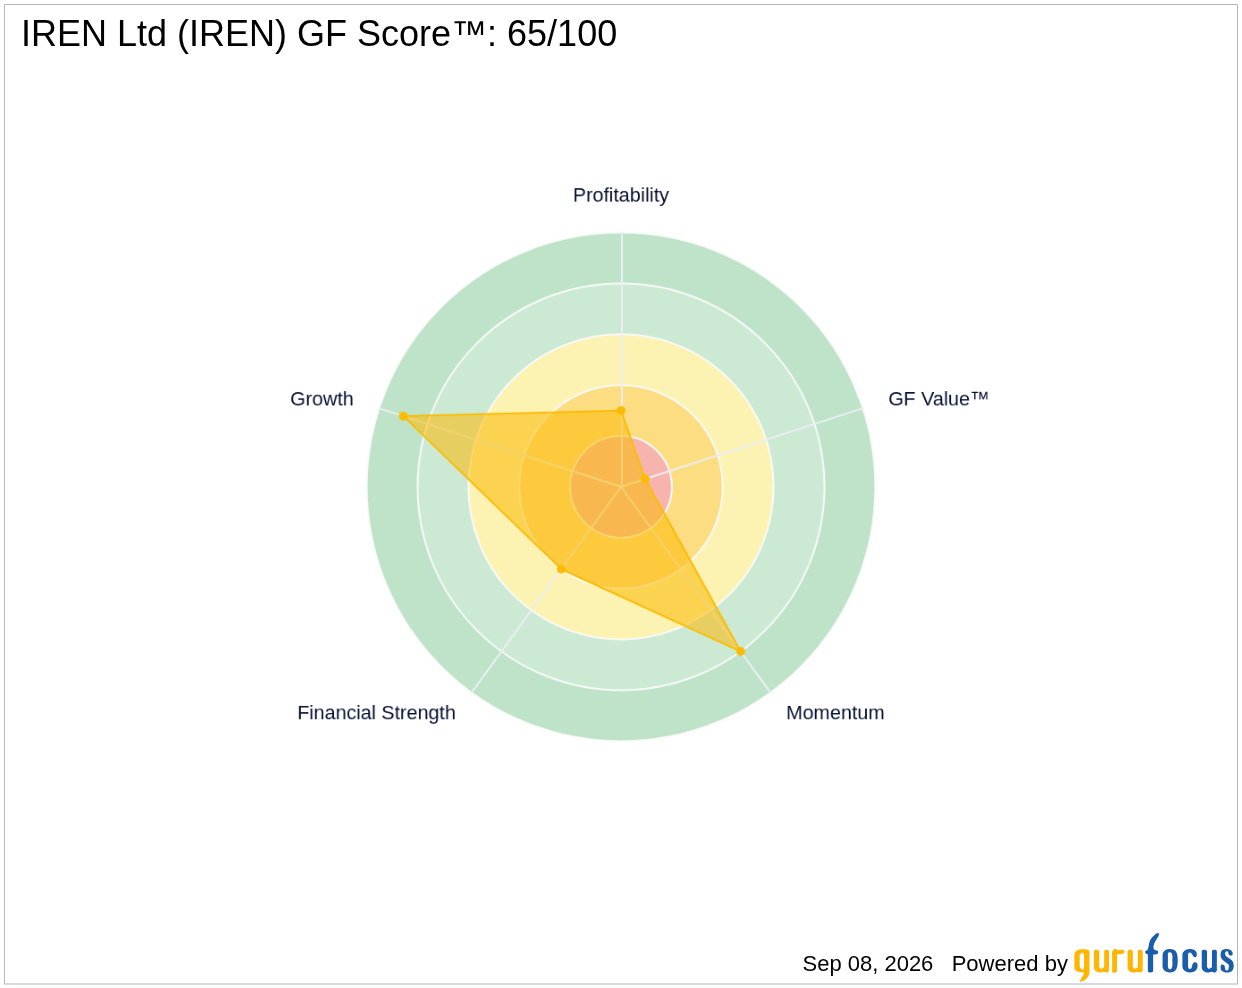
- The company’s GF Score™ is 65 out of 100, indicating a moderate overall fundamental health with notable strengths and weaknesses.
- Insider activity shows no recent purchases but $66.7 million in insider sales over the past 12 months, while five premium gurus hold IREN with a net positive addition of three gurus adding shares versus two trimming.
What's Behind the News?
The recent jump in Iris Energy’s stock price and the surge in options volume reflect a growing investor interest and a cautiously optimistic outlook on the company’s prospects. With 406,000 contracts traded and a put/call ratio of 0.42—below the typical 0.5—market participants are favoring call options, signaling bullish sentiment. Additionally, implied volatility rose to 87.13, still within the lower decile of the past year’s range, suggesting anticipated daily price swings around $2.64. The flattening of the put-call skew further supports a mildly positive market view.
IREN Ltd operates data centers powered by renewable energy across Canada and the US, primarily focusing on bitcoin mining and AI cloud infrastructure. The company is actively transitioning its bitcoin mining capacity toward AI applications and expanding its footprint by securing additional power and land resources. With a market capitalization of $19.06 billion, IREN is classified within the Financial Services sector under the Capital Markets industry, positioning itself at the intersection of technology and sustainable energy.
Is IREN Overvalued on a Price-to-Sales Basis?
IREN’s current Price-to-Sales ratio of 23.06 dramatically overshoots its historical median of 5.5 and typical industry levels. This premium valuation implies that investors are pricing in aggressive future revenue growth and operational scaling, likely tied to the company’s pivot toward AI infrastructure and renewable energy data centers. However, it is critical to note that IREN remains unprofitable and cash-flow negative, with a trailing twelve-month EPS of -2.34 and negative operating margins. As such, traditional earnings-based valuation metrics like the P/E ratio are not meaningful for this stock.
GuruFocus’ proprietary GF Value™ metric estimates IREN’s intrinsic value at $20.13 per share, suggesting the stock is approximately 140.3% overvalued relative to its current price near $48.37. While this figure should not be interpreted as a precise fair value—given that GF Value™ relies heavily on historical multiples that are less reliable for loss-making companies—it serves as a directional warning that the market’s growth expectations may be priced to perfection. Investors should weigh this alongside other fundamental and market signals. For more on GF Value™, see GF Value™.
What Does IREN's GF Score™ Tell Us?
The GF Score™ is a composite measure designed to assess a company’s overall financial health by integrating factors such as profitability, growth, financial strength, valuation, and momentum. IREN’s GF Score™ of 65/100 reflects a mixed fundamental profile, with particular strengths in growth and momentum but notable weaknesses in profitability and valuation.
| Metric | Rating (out of 10) |
|---|---|
| GF Score™ | 65 |
| Financial Strength | 4 |
| Profitability | 3 |
| Growth | 9 |
| Valuation | 1 |
| Momentum | 8 |
IREN’s strongest area is growth, scoring 9/10, supported by a three-year revenue growth rate of 17.5% and a 31.1% growth in EBITDA over three years. Momentum is also robust at 8/10, reflecting recent positive price action and trading volume. However, profitability remains a significant concern with a low score of 3/10 due to persistent net losses and negative margins. Financial strength is moderate at 4/10, with a concerning Altman Z-Score of 1.13 indicating distress risk, and a Piotroski F-Score of 2 signaling operational challenges. Valuation ranks lowest at 1/10, consistent with the GF Value™ overvaluation signal. For further details, visit the IREN stock page.
What Are Gurus and Insiders Doing with IREN?
GuruFocus tracks that five premium gurus currently hold IREN shares. In recent quarters, three gurus have increased their positions while two have trimmed theirs, indicating a slight net positive sentiment among these influential investors. This guru ownership data is a distinctive feature of GuruFocus, providing deeper insight beyond typical institutional holdings data found on platforms like Simply Wall St or Morningstar.
In contrast, insider activity over the past 12 months shows no insider buying but significant insider selling totaling $66.7 million. This divergence between guru accumulation and insider selling may reflect differing views on the company’s near-term prospects or liquidity needs by insiders.
What This Means for Investors
IREN’s valuation on a Price-to-Sales basis is exceptionally elevated, signaling that the market is pricing in substantial future growth despite ongoing unprofitability and cash-flow challenges. The GF Value™ metric corroborates this as a directional warning that the stock may be significantly overvalued relative to its historical fundamentals. Meanwhile, the mixed GF Score™ highlights solid growth and momentum but weak profitability and financial stability. The contrasting signals from guru buying and insider selling add complexity to the investment thesis, suggesting cautious optimism from sophisticated investors but potential reservations from insiders.
Investors should carefully consider whether IREN’s ambitious growth plans and market positioning justify the current premium valuation or if the risks inherent in its financial profile warrant a more conservative approach. For a comprehensive view of IREN’s fundamentals and market data, explore the IREN stock page and consider screening for similar opportunities with the GuruFocus Stock Screener.
Frequently Asked Questions
What is IREN's GF Score™?
IREN’s GF Score™ of 65/100 reflects a moderate overall fundamental health, with strong growth and momentum offset by weak profitability and valuation metrics.
Is IREN overvalued or undervalued?
Based on its Price-to-Sales ratio of 23.06, which is significantly above its historical median and industry averages, IREN appears overvalued. Earnings-based valuation metrics like P/E are not meaningful due to the company’s ongoing losses.
What is IREN's P/E ratio compared to historical?
IREN currently has no meaningful P/E ratio due to negative earnings. Instead, investors should focus on other metrics like Price-to-Sales and GF Score™ to assess financial health and valuation risks.
This stock alert was generated using automated technology and GuruFocus financial data to provide readers with timely and accurate market reporting. This content was reviewed by GuruFocus editorial team prior to publication. Please send any questions or comments about this story to [email protected].

