


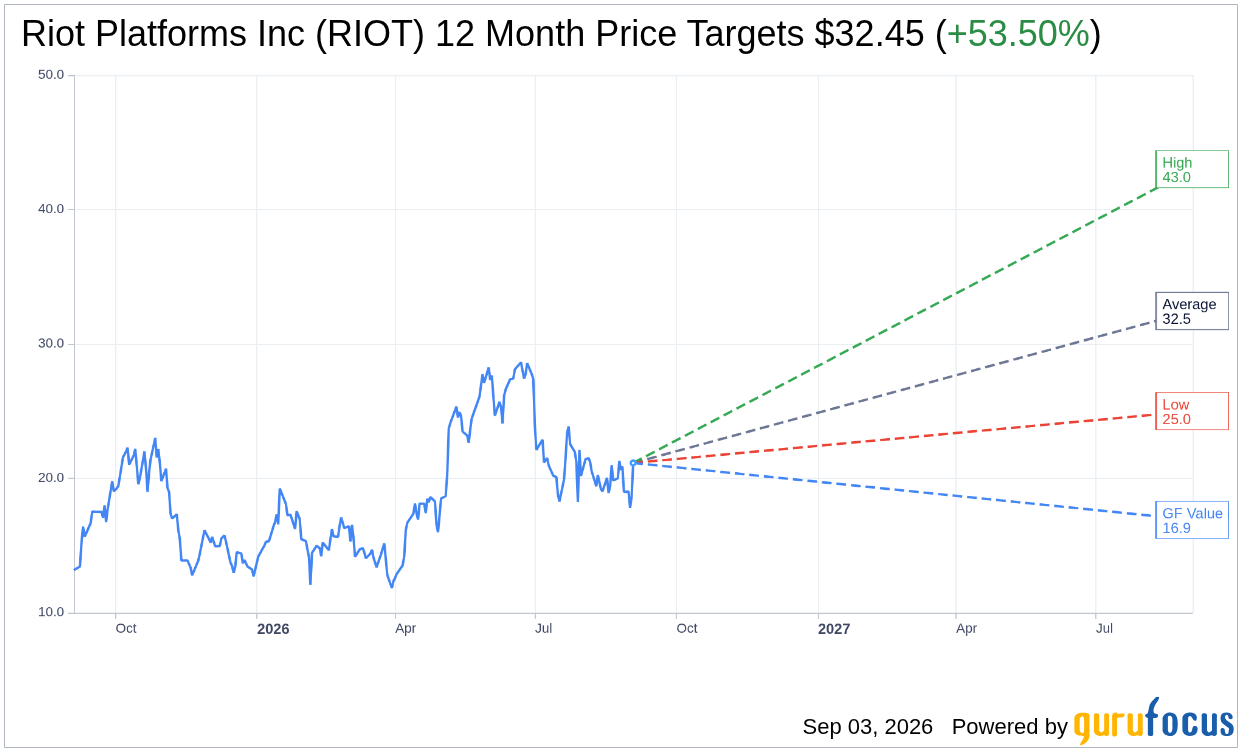
On September 03, 2026, Riot Platforms Inc RIOT shares rose 13.4% today, bringing the current price to $21.14. The stock has experienced a 52-week range of $11.50 to $30.32.
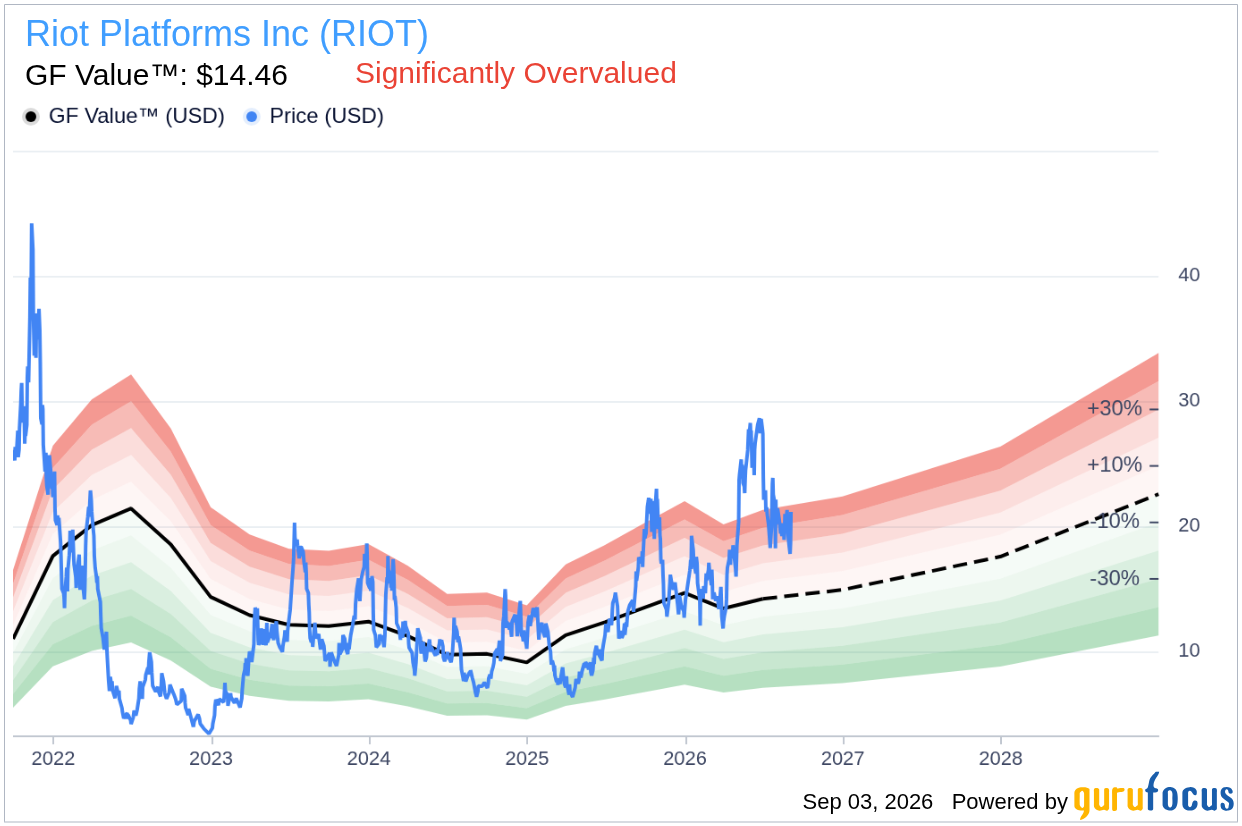
- GF Value™ verdict: Current price of $21.14 vs GF Value of $14.46, indicating it is 46.2% overvalued.
- GF Score™ of 74/100, categorized as Above Average.
- Most notable signal: Insiders sold $20.7M worth of shares over the past 12 months without any buying activity.
Is RIOT Overvalued or Undervalued?
Riot Platforms Inc RIOT currently trades at $21.14, which is significantly above its GF Value™ of $14.46. This discrepancy suggests that the stock is overvalued by approximately 46.2%. GF Value™ is GuruFocus' proprietary estimate of a stock's intrinsic value, calculated through a comprehensive assessment of historical trading multiples, past business performance, and future growth expectations. Given that RIOT is an unprofitable company, relying on earnings-based valuations such as Price-to-Earnings (P/E) is not appropriate. Instead, a Price-to-Sales (P/S) analysis would provide a clearer picture of RIOT's valuation, especially since its historical median P/S ratio stands at approximately 8.8x.
The GF Valuation label indicates that RIOT is significantly overvalued. This presents a risk for potential investors, as the current price does not reflect the company's intrinsic value based on its sales performance. Caution is warranted, as an overvalued stock may face downward pressure in the future.
How Does RIOT's Valuation Compare to Its History?
| Metric | Current | Historical |
|---|---|---|
| P/E (TTM) | Not applicable | 46.4x (5-Year Median) |
| Forward P/E | 538.3x | Not applicable |
Since RIOT does not currently have a meaningful P/E ratio due to its unprofitability, this analysis cannot be directly applied. However, the forward P/E ratio of 538.3x highlights the extreme nature of its current valuation, which supports the GF Value™ verdict of being overvalued.
What Does RIOT's GF Score™ Tell Us?
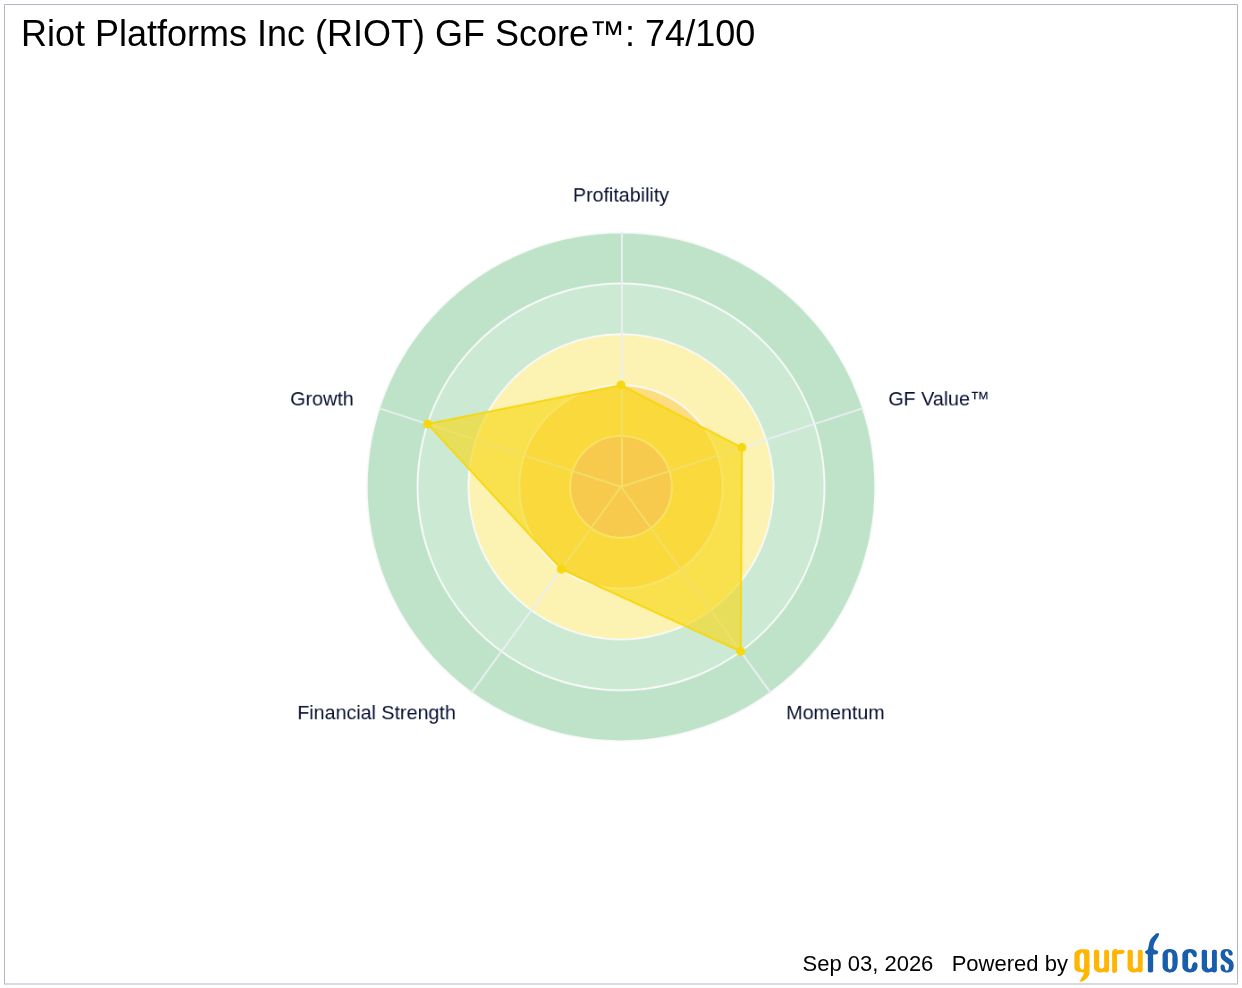
The GF Score™ provides a comprehensive evaluation of a company's financial health, growth potential, profitability, and valuation relative to its peers. Riot's score of 74/100 indicates it is above average, with particular strengths in growth potential and momentum.
| Metric | Rating |
|---|---|
| GF Score™ | 74 |
| Financial Strength | 4/10 |
| Profitability | 4/10 |
| Growth | 8/10 |
| Valuation | 5/10 |
| Momentum | 8/10 |
RIOT's strengths are particularly evident in its growth and momentum ranks, both rated 8/10. However, its financial strength and profitability scores, at 4/10, indicate significant weaknesses that should be considered when assessing its overall financial picture.
What Are Gurus and Insiders Doing with RIOT?
Currently, five gurus hold shares of RIOT, with three increasing their positions and three reducing their stakes in recent quarters. This reflects a mixed sentiment among institutional investors regarding the company's future prospects. Additionally, insider activity has seen a notable trend, with insiders selling $20.7M worth of shares over the past 12 months and no reported buying. This pattern suggests a lack of confidence from insiders about the company's near-term performance, which could serve as a cautionary indicator for other investors.
What This Means for Investors
Considering the analysis above, it is clear that Riot Platforms Inc RIOT is currently overvalued based on its GF Value™ assessment. The significant gap between its current trading price and intrinsic value indicates potential risks for investors looking to enter the stock at this time. For further details on Riot Platforms Inc (RIOT), please visit the Riot Platforms Inc (RIOT) stock page.
Frequently Asked Questions
What is RIOT's GF Score™?
RIOT's GF Score™ is 74/100, indicating an above-average ranking based on various financial metrics and growth potential.
Is RIOT overvalued or undervalued?
RIOT is considered overvalued, with a GF Value™ of $14.46 compared to its current price of $21.14.
What is RIOT's P/E ratio?
RIOT does not have a meaningful P/E ratio due to its unprofitability; its forward P/E is 538.3x, indicating extreme valuation levels.
This stock alert was generated using automated technology and GuruFocus financial data to provide readers with timely and accurate market reporting. This content was reviewed by GuruFocus editorial team prior to publication. Please send any questions or comments about this story to [email protected].

