

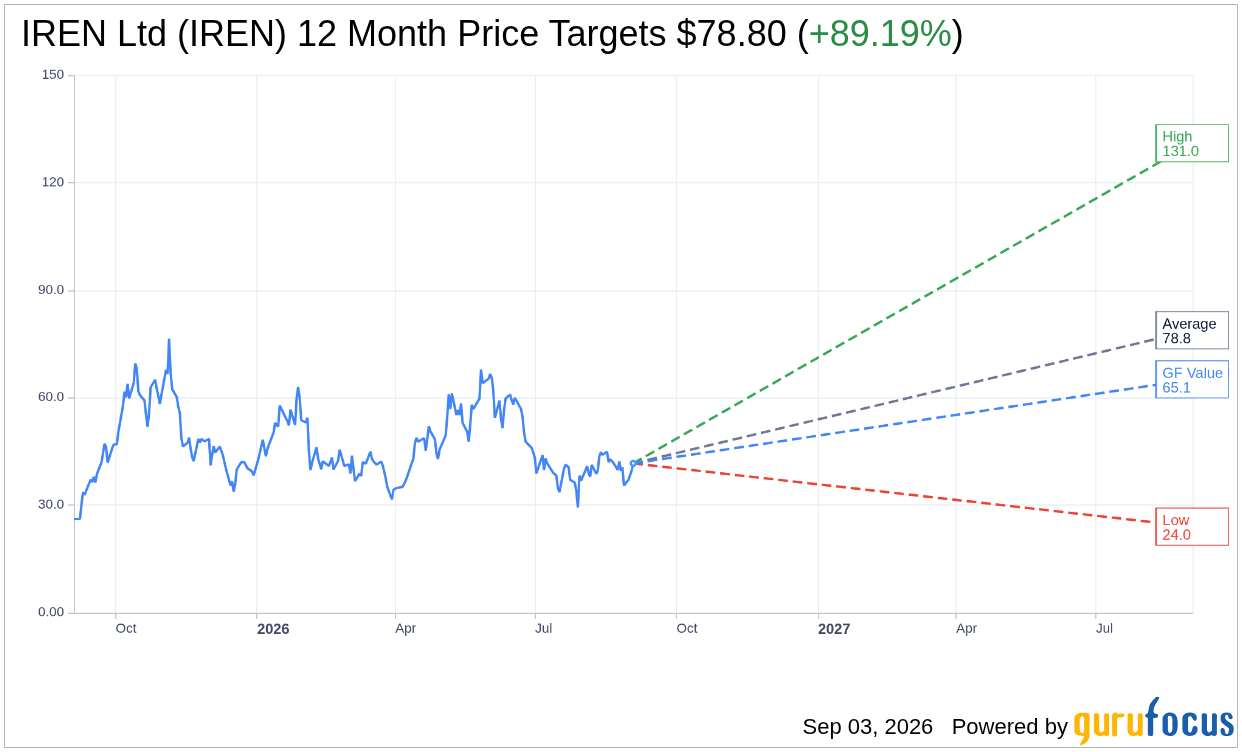
On September 03, 2026, IREN Ltd IREN shares rose 5.2% to a current price of $41.65. The stock has seen a 52-week range of $25.31 to $76.87, reflecting significant volatility over the past year.
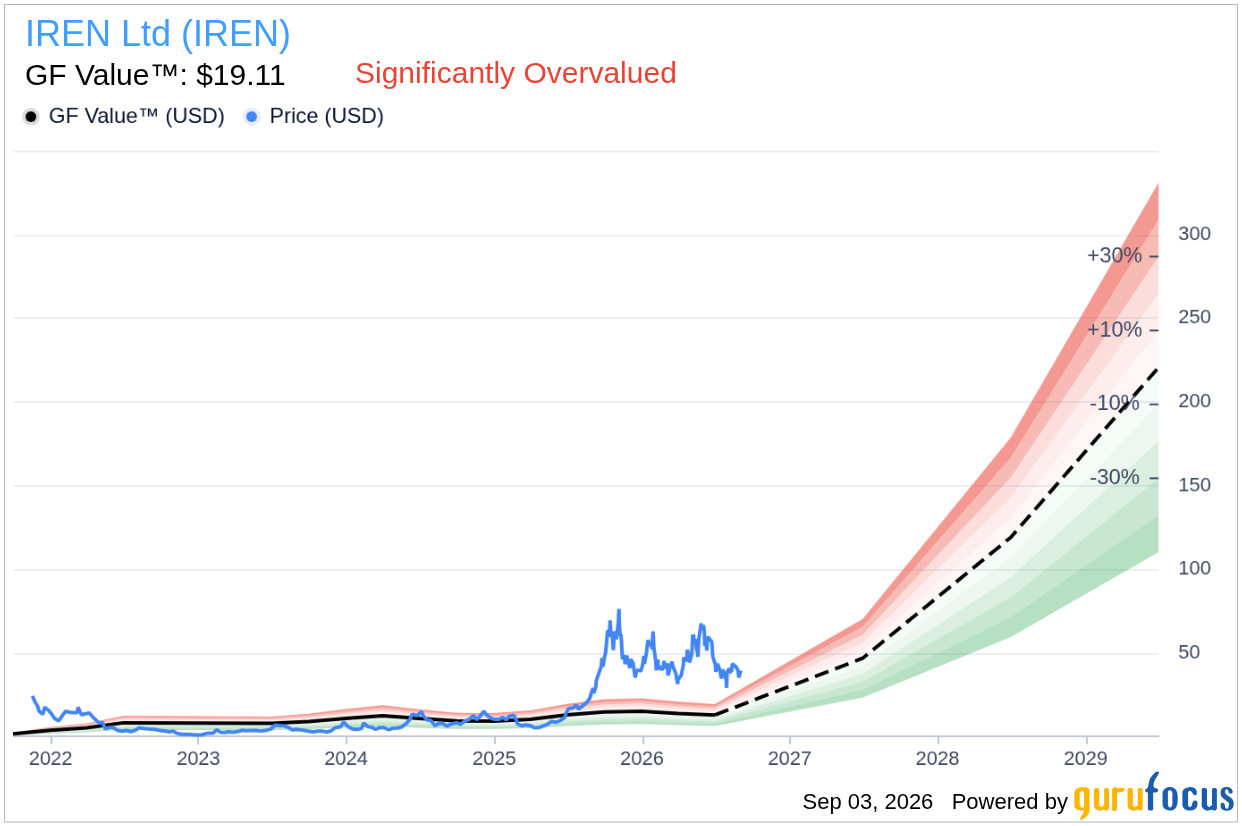
- GF Value™ verdict: Current price is $41.65, compared to GF Value at $19.11, indicating a 117.9% overvaluation.
- GF Score™ of 65/100 signifies an above-average performance compared to its peers.
- Most notable signal: Insiders have sold $66.7 million worth of shares over the past 12 months without any buying activity.
Is IREN Overvalued or Undervalued?
The current market valuation of IREN Ltd appears to be significantly overvalued when compared to the GF Value™, which estimates the fair value of the stock at $19.11. This represents a substantial margin of safety for potential investors, as the current trading price is approximately 117.9% above this intrinsic value. GF Value™ is GuruFocus' proprietary estimate of a stock's fair value, derived from a combination of historical trading multiples, past business growth, and future performance metrics. In this case, the GF Valuation label categorizes IREN as significantly overvalued, posing risks for those considering entering at this price point.
Given the current price of $41.65, the risk of a correction is heightened, particularly in light of the company's status as a cash-flow-negative entity. Investors should be cautious as earnings-based valuations such as the Price-to-Earnings (P/E) ratio may not apply effectively to IREN's situation. The overvaluation warning is further underscored by the company’s deteriorating financial metrics and the lack of insider buying, suggesting a lack of confidence from those closest to the company.
How Does IREN's Valuation Compare to Its History?
| Metric | Current | Historical |
|---|---|---|
| P/E (TTM) | Not Applicable (N/A) | 35.1x |
| Forward P/E | 21762.2x | N/A |
IREN's current valuation metrics present a stark contrast to its historical P/E levels. The absence of a meaningful P/E ratio due to the company's unprofitability makes traditional earnings-based assessments ineffective. The forward P/E of 21762.2x further reinforces the notion that IREN is trading at an unsustainable level compared to its historical median P/E of 35.1x. This analysis aligns with the GF Value™ verdict, indicating significant overvaluation despite its historical performance.
What Does IREN's GF Score™ Tell Us?
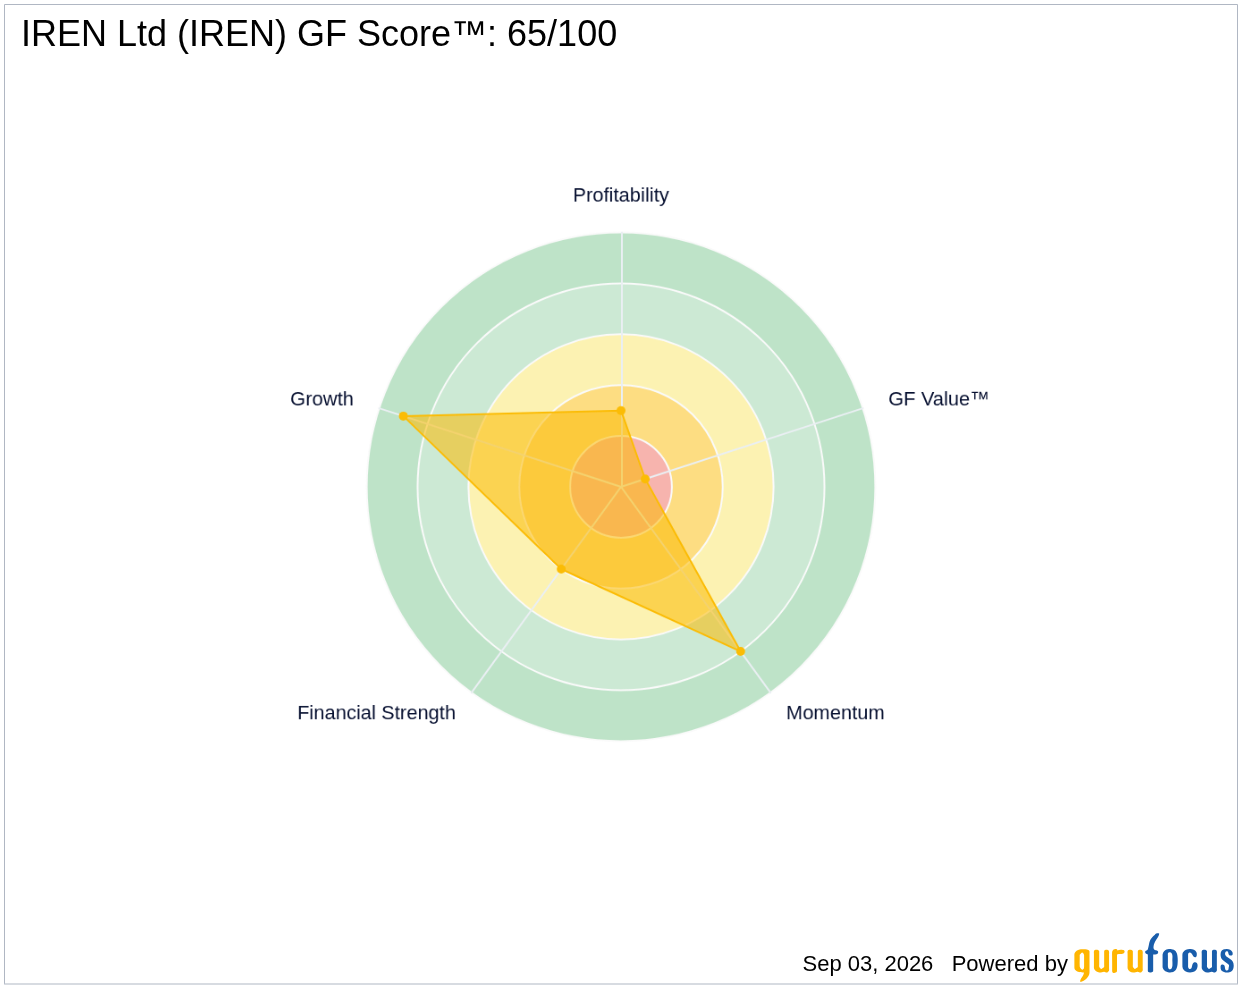
The GF Score™ is a comprehensive measure that evaluates a company's financial strength, profitability, growth potential, valuation, and momentum. IREN's GF Score™ of 65/100 indicates that it performs above average relative to its peers, although certain sub-ranks reveal areas of concern.
| Metric | Rating |
|---|---|
| GF Score™ | 65 |
| Financial Strength | 4/10 |
| Profitability | 3/10 |
| Growth | 9/10 |
| Valuation | 1/10 |
| Momentum | 8/10 |
While IREN's strongest area lies in its growth rank of 9/10, indicating potential for future expansion, its weakest aspect is the valuation rank of 1/10, which aligns with the significant overvaluation indicated by the GF Value™. The financial strength and profitability ranks are also concerning, highlighting the company's struggles in maintaining robust financial health.
What Are Gurus and Insiders Doing with IREN?
Currently, 5 gurus hold positions in IREN, with 3 increasing their stakes and 2 trimming their holdings in recent quarters. This mixed signal from the guru community suggests a cautious approach among seasoned investors, with some finding value while others are reducing exposure.
However, insider activity reveals a concerning trend, as insiders have sold $66.7 million worth of shares over the past year, with no reported buying activity. This pattern may indicate a lack of confidence from company insiders regarding the stock's future performance, adding another layer of risk for potential investors.
What This Means for Investors
In summary, IREN Ltd appears to be overvalued based on the GF Value™ assessment, which suggests a significant disconnect between market price and intrinsic value. Given the company's unprofitability and cash-flow-negative status, coupled with the concerning signals from both insider activity and valuation metrics, caution is advised for those considering investment in IREN at current levels. For further analysis, you may visit the IREN Ltd IREN stock page for more insights.
Frequently Asked Questions
What is IREN's GF Score™?
IREN's GF Score™ is 65/100, indicating that it performs above average compared to its peers.
Is IREN overvalued or undervalued?
IREN is currently overvalued, with a GF Value™ estimate of $19.11 compared to its market price of $41.65.
What is IREN's P/E ratio?
IREN does not have a meaningful P/E ratio due to its unprofitability; the forward P/E stands at an extremely high 21762.2x.
This stock alert was generated using automated technology and GuruFocus financial data to provide readers with timely and accurate market reporting. This content was reviewed by GuruFocus editorial team prior to publication. Please send any questions or comments about this story to [email protected].

