

On August 24, 2026, IREN Ltd IREN shares fell 4.9% to $39.81, continuing a downward trend that has seen the stock drop 11.3% over the past week. Over the last year, IREN's shares have experienced significant volatility, with a 52-week high of $76.87 and a low of $18.87.
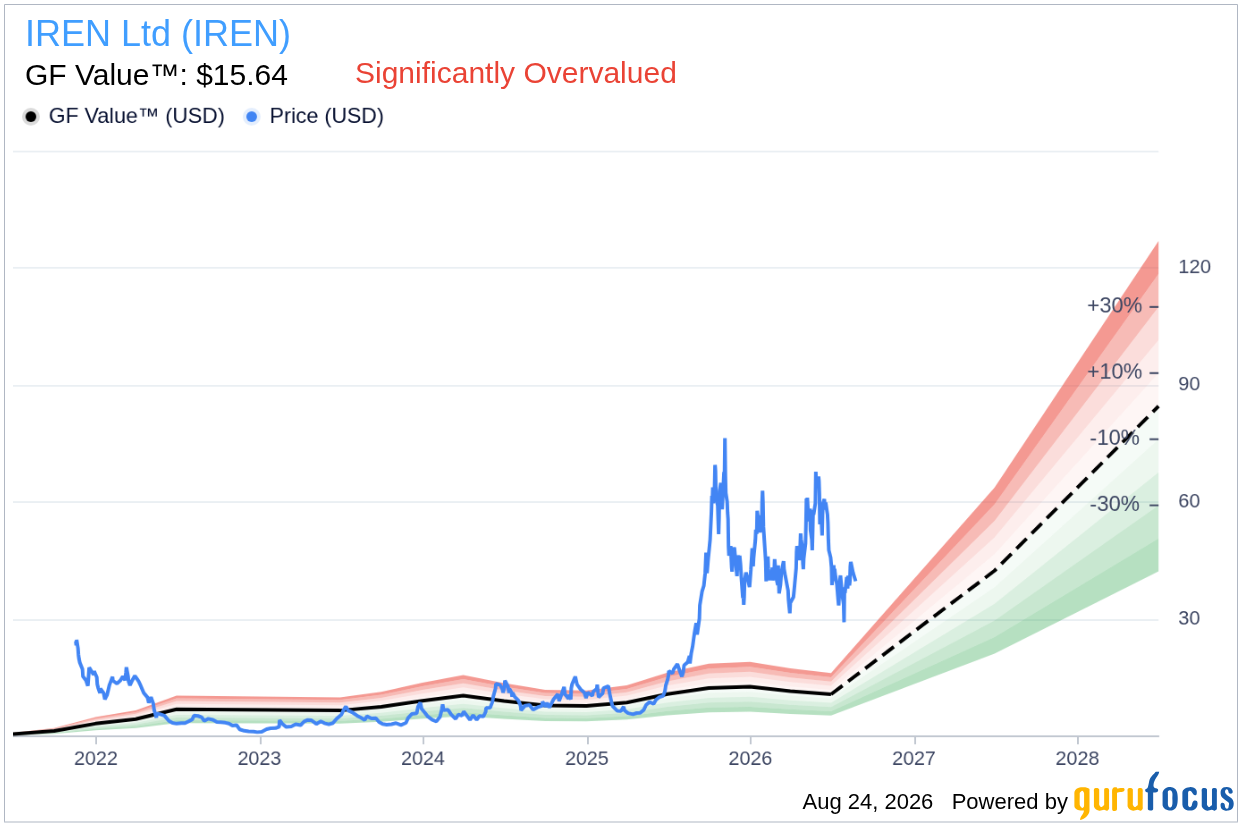
- GF Value™ verdict: Current price of $39.81 vs GF Value of $15.64, indicating the stock is 154.5% overvalued.
- GF Score™: 67/100, classified as Above Average.
- Most notable signal: Insiders sold $66.7M worth of shares over the past 12 months, with no reported buying activity.
Is IREN Overvalued or Undervalued?
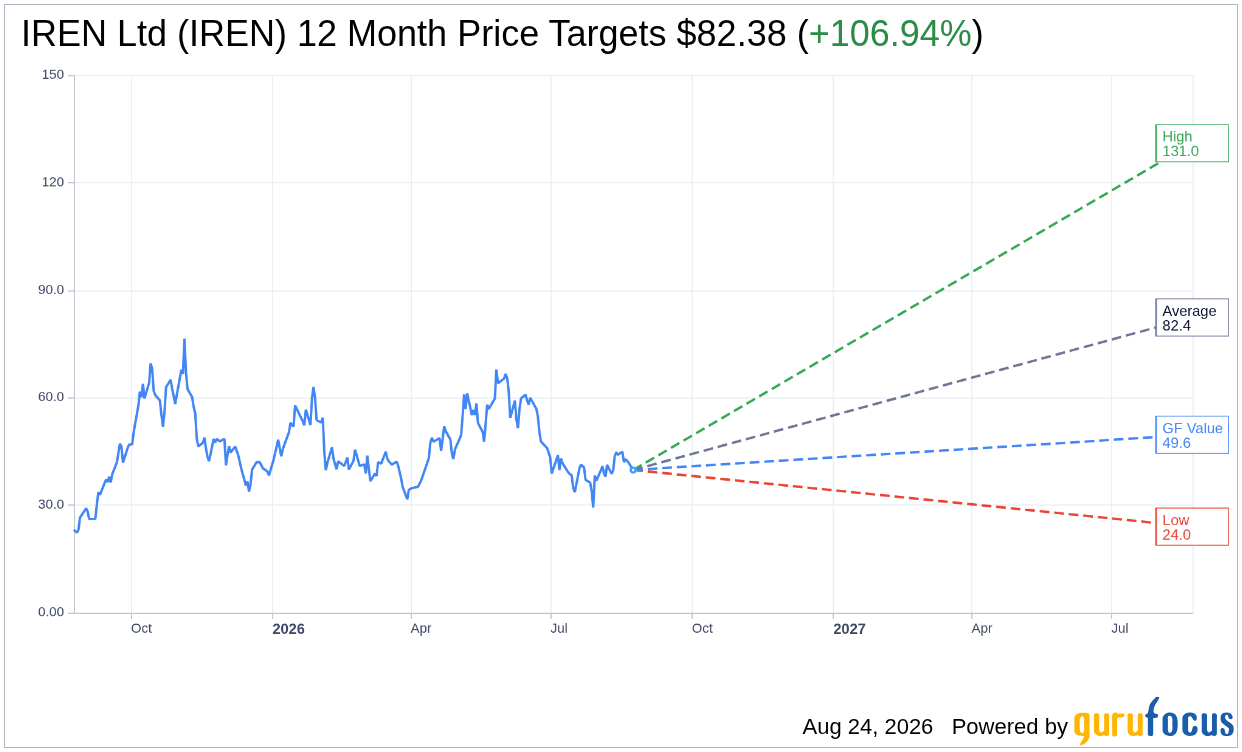
IREN Ltd’s current market price of $39.81 is significantly higher than its GF Value™ estimate of $15.64, suggesting that the stock is 154.5% overvalued. GF Value™ is GuruFocus' proprietary intrinsic-value estimate, which is derived from an analysis of historical trading multiples, past business growth, and future performance estimates. The significant disparity between the current price and the GF Value™ serves as a cautionary indicator for potential risks associated with investing in IREN at this time.
The GF Valuation label categorizes IREN as significantly overvalued, signaling that the stock price does not reflect the underlying fundamentals of the company, especially considering that IREN is currently unprofitable and cash-flow-negative. This presents a margin of safety concern for investors, as purchasing shares at inflated prices may lead to substantial losses if the market corrects itself.
How Does IREN's Valuation Compare to Its History?
| Metric | Current | Historical |
|---|---|---|
| P/E (TTM) | 78.8x | 36.3x |
| Forward P/E | 20799.8x | N/A |
IREN's current P/E ratio of 78.8x is significantly above its 5-year median P/E of 36.3x, indicating that the stock is trading at a premium compared to its historical valuation. This analysis aligns with the GF Value™ verdict, reinforcing the notion that IREN is currently overvalued based on both earnings and historical performance metrics.
What Does IREN's GF Score™ Tell Us?
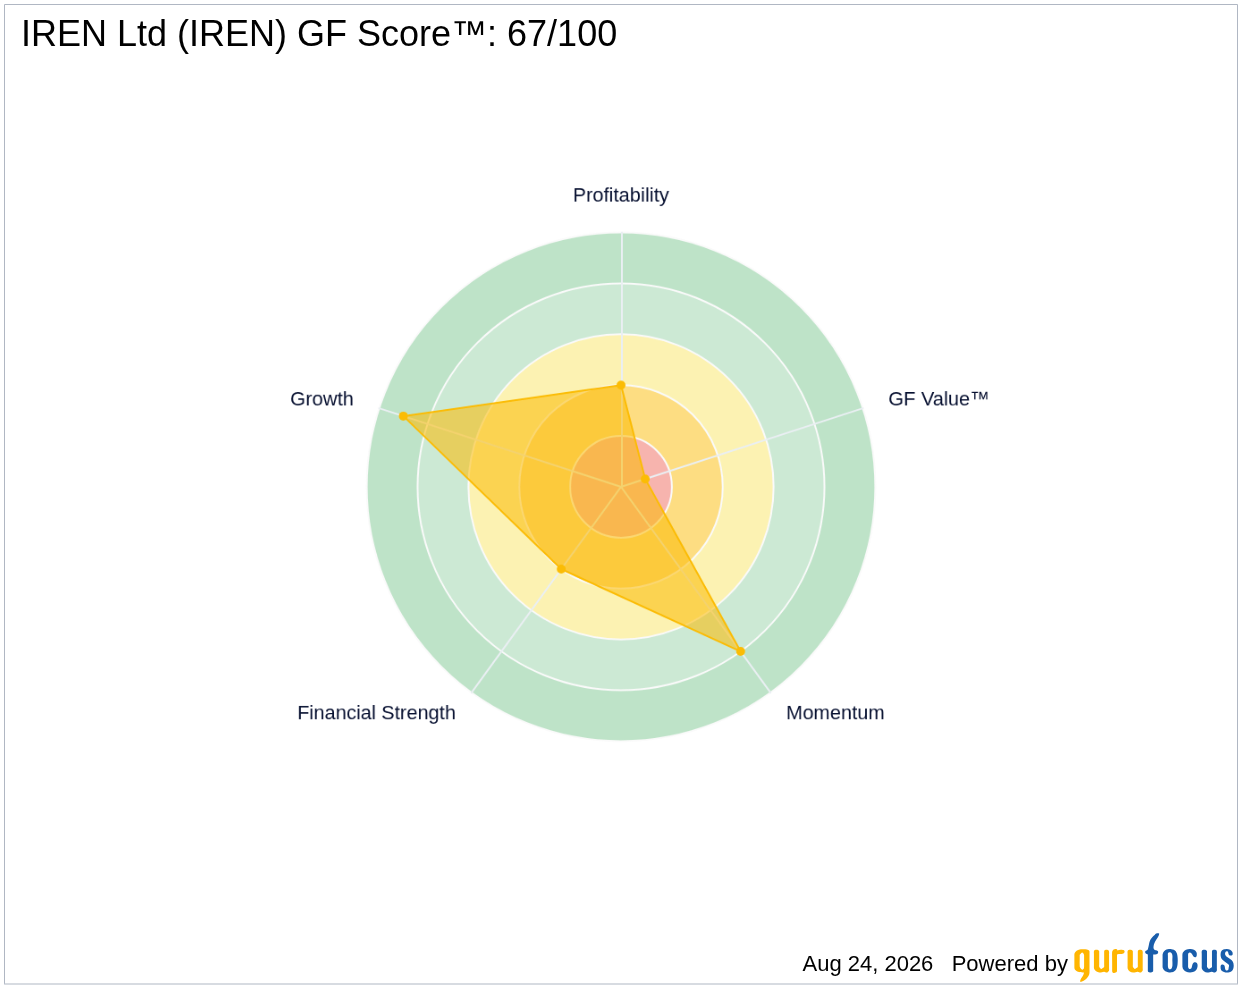
The GF Score™ measures a stock's health across various dimensions, including financial strength, profitability, growth prospects, valuation, and momentum. IREN's GF Score™ of 67/100 indicates that it is performing above average in the market, with its strongest rank in growth (9/10) but weaker ranks in valuation (1/10) and financial strength (4/10).
| Metric | Rating |
|---|---|
| GF Score™ | 67 |
| Financial Strength | 4/10 |
| Profitability | 4/10 |
| Growth | 9/10 |
| Valuation | 1/10 |
| Momentum | 8/10 |
IREN's scores suggest a company that is showing strong growth potential while facing challenges in profitability and valuation. The high growth rank indicates a robust outlook for future performance, but the low valuation rank underscores the risk of overvaluation in the current market environment.
What Are Gurus and Insiders Doing with IREN?
Currently, five gurus hold positions in IREN, with three increasing their stakes and two reducing them in recent quarters. This activity demonstrates a mixed sentiment among institutional investors regarding IREN's prospects. However, the notable insider selling of $66.7M over the past 12 months, without any reported buying, raises red flags about management's confidence in the company's future performance.
The contrast between guru activity and insider selling suggests a potential lack of alignment between external investor confidence and internal management sentiment, which may caution prospective investors about the stock's future trajectory.
What This Means for Investors
Based on the significant gap between the current stock price and the GF Value™, along with the company's unprofitability and negative cash flow, IREN Ltd appears to be overvalued at this time. Investors should exercise caution when considering an investment in IREN, as the stock's current valuation does not reflect its underlying fundamentals. For more detailed insights, visit the IREN Ltd IREN stock page.
Frequently Asked Questions
What is IREN's GF Score™?
IREN's GF Score™ is 67, indicating above-average performance in the market.
Is IREN overvalued or undervalued?
IREN is considered overvalued, with a significant discrepancy between its current price and GF Value™ estimate.
What is IREN's P/E ratio?
IREN's P/E ratio is 78.8x, which is well above its 5-year median P/E of 36.3x, indicating that the stock is trading at a premium compared to its historical valuation.
This stock alert was generated using automated technology and GuruFocus financial data to provide readers with timely and accurate market reporting. This content was reviewed by GuruFocus editorial team prior to publication. Please send any questions or comments about this story to [email protected].

